
|
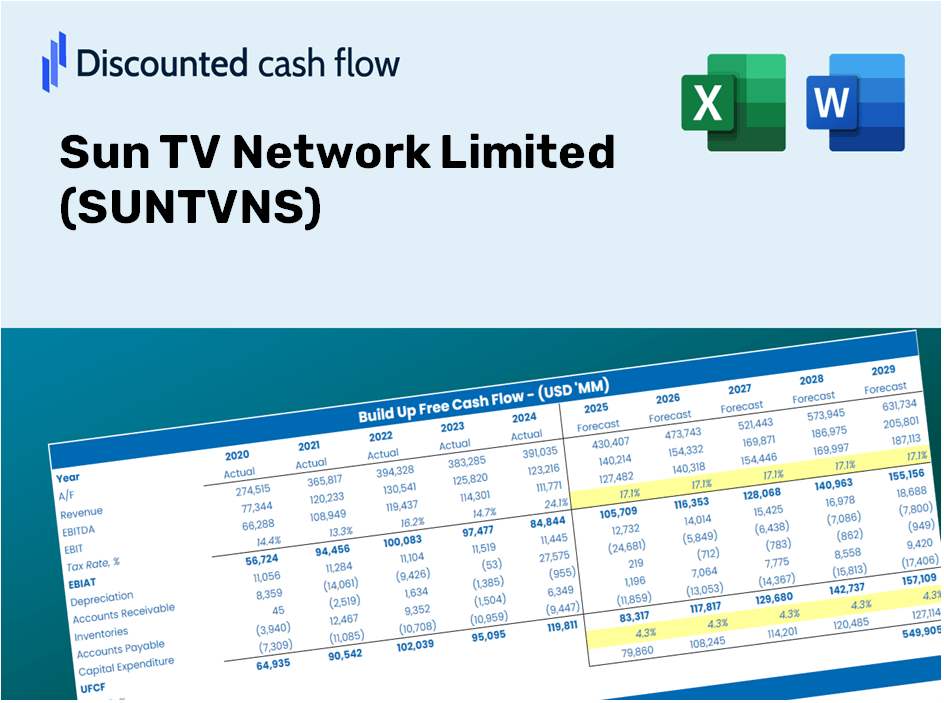
Sun TV Network Limited (SUNTV.NS) Évaluation DCF |
Entièrement Modifiable: Adapté À Vos Besoins Dans Excel Ou Sheets
Conception Professionnelle: Modèles Fiables Et Conformes Aux Normes Du Secteur
Pré-Construits Pour Une Utilisation Rapide Et Efficace
Compatible MAC/PC, entièrement débloqué
Aucune Expertise N'Est Requise; Facile À Suivre
Sun TV Network Limited (SUNTV.NS) Bundle
Vous cherchez à déterminer la valeur intrinsèque de Sun TV Network Limited? Notre calculatrice DCF (SUNTVNS) intègre des données réelles avec des fonctionnalités de personnalisation approfondies, vous permettant d'affiner vos prévisions et de faire des choix d'investissement plus éclairés.
What You Will Receive
- Customizable Forecast Inputs: Seamlessly adjust key parameters (growth %, margins, WACC) to generate various scenarios.
- Real-Time Financial Data: Sun TV Network Limited’s financial information pre-loaded to enhance your analysis.
- Automatic DCF Calculations: The template computes Net Present Value (NPV) and intrinsic value automatically.
- Professional and Tailored: A sleek Excel model that conforms to your valuation requirements.
- Designed for Analysts and Investors: Perfect for evaluating projections, confirming strategies, and maximizing efficiency.
Key Features
- Real-Life SUNTVNS Data: Pre-loaded with Sun TV Network Limited's historical financial information and future growth projections.
- Fully Customizable Inputs: Tailor revenue growth rates, profit margins, WACC, tax rates, and capital expenditures to suit your analysis.
- Dynamic Valuation Model: Instantaneous updates to Net Present Value (NPV) and intrinsic value based on your custom inputs.
- Scenario Testing: Develop various forecasting scenarios to evaluate different valuation results.
- User-Friendly Design: Intuitive, organized, and crafted for both professionals and novices.
How It Functions
- 1. Access the Template: Download and open the Excel file featuring Sun TV Network Limited’s (SUNTVNS) prepopulated data.
- 2. Modify Assumptions: Adjust essential inputs such as growth rates, weighted average cost of capital (WACC), and capital expenditures.
- 3. View Real-Time Results: The DCF model automatically calculates intrinsic value and net present value (NPV).
- 4. Explore Scenarios: Evaluate various forecasts to assess different valuation implications.
- 5. Present with Assurance: Deliver professional valuation analyses to inform your decision-making.
Why Opt for This Calculator?
- All-in-One Solution: Integrates DCF, WACC, and financial ratio assessments seamlessly.
- Flexible Parameters: Modify the yellow-highlighted fields to explore different outcomes.
- In-Depth Analysis: Automatically computes the intrinsic value and Net Present Value for Sun TV Network Limited (SUNTVNS).
- Ready-to-Use Data: Includes both historical and projected data for reliable analysis.
- High-Quality Standards: Tailored for financial analysts, investors, and business consultants.
Who Can Benefit From This Product?
- Professional Investors: Create intricate and dependable valuation models for analyzing their portfolios involving Sun TV Network Limited (SUNTVNS).
- Corporate Finance Teams: Evaluate valuation scenarios to inform and direct internal corporate strategies for Sun TV Network Limited (SUNTVNS).
- Consultants and Advisors: Offer clients precise valuation insights related to Sun TV Network Limited (SUNTVNS).
- Students and Educators: Employ real-world data to learn and teach financial modeling techniques using Sun TV Network Limited (SUNTVNS) as a case study.
- Media Analysts and Enthusiasts: Gain an understanding of how media companies, particularly Sun TV Network Limited (SUNTVNS), are valued in the marketplace.
Contents of the Template
- Comprehensive DCF Model: Editable template featuring thorough valuation calculations.
- Real-World Data: Sun TV Network Limited’s (SUNTVNS) historical and projected financials preloaded for analysis.
- Customizable Parameters: Modify WACC, growth rates, and tax assumptions to explore different scenarios.
- Financial Statements: Complete annual and quarterly breakdowns for enhanced insights.
- Key Ratios: Integrated analysis for profitability, efficiency, and leverage metrics.
- Dashboard with Visual Outputs: Charts and tables that present clear, actionable results.
Disclaimer
All information, articles, and product details provided on this website are for general informational and educational purposes only. We do not claim any ownership over, nor do we intend to infringe upon, any trademarks, copyrights, logos, brand names, or other intellectual property mentioned or depicted on this site. Such intellectual property remains the property of its respective owners, and any references here are made solely for identification or informational purposes, without implying any affiliation, endorsement, or partnership.
We make no representations or warranties, express or implied, regarding the accuracy, completeness, or suitability of any content or products presented. Nothing on this website should be construed as legal, tax, investment, financial, medical, or other professional advice. In addition, no part of this site—including articles or product references—constitutes a solicitation, recommendation, endorsement, advertisement, or offer to buy or sell any securities, franchises, or other financial instruments, particularly in jurisdictions where such activity would be unlawful.
All content is of a general nature and may not address the specific circumstances of any individual or entity. It is not a substitute for professional advice or services. Any actions you take based on the information provided here are strictly at your own risk. You accept full responsibility for any decisions or outcomes arising from your use of this website and agree to release us from any liability in connection with your use of, or reliance upon, the content or products found herein.