
|
L'évaluation du DCF Limited (Supremeind.NS) |
Entièrement Modifiable: Adapté À Vos Besoins Dans Excel Ou Sheets
Conception Professionnelle: Modèles Fiables Et Conformes Aux Normes Du Secteur
Pré-Construits Pour Une Utilisation Rapide Et Efficace
Compatible MAC/PC, entièrement débloqué
Aucune Expertise N'Est Requise; Facile À Suivre
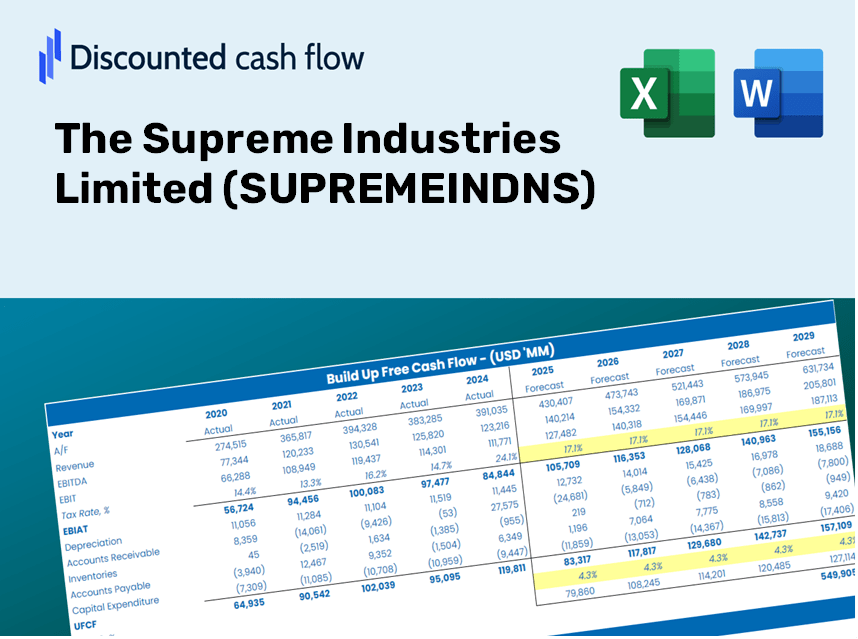
The Supreme Industries Limited (SUPREMEIND.NS) Bundle
Explorez l'avenir financier du Supreme Industries Limited (Supremeindns) avec notre calculatrice DCF conviviale! Entrez vos projections pour la croissance, les marges et les dépenses pour calculer la valeur intrinsèque de la Supreme Industries Limited (Supremeindns) et améliorez vos décisions d'investissement.
Discounted Cash Flow (DCF) - (USD MM)
| Year | AY1 2021 |
AY2 2022 |
AY3 2023 |
AY4 2024 |
AY5 2025 |
FY1 2026 |
FY2 2027 |
FY3 2028 |
FY4 2029 |
FY5 2030 |
|---|---|---|---|---|---|---|---|---|---|---|
| Revenue | 63,552.0 | 77,728.2 | 92,015.9 | 101,342.6 | 104,462.5 | 118,539.5 | 134,513.5 | 152,640.0 | 173,209.3 | 196,550.4 |
| Revenue Growth, % | 0 | 22.31 | 18.38 | 10.14 | 3.08 | 13.48 | 13.48 | 13.48 | 13.48 | 13.48 |
| EBITDA | 12,705.4 | 12,396.9 | 11,970.3 | 15,421.7 | 14,316.1 | 18,461.8 | 20,949.7 | 23,772.8 | 26,976.3 | 30,611.6 |
| EBITDA, % | 19.99 | 15.95 | 13.01 | 15.22 | 13.7 | 15.57 | 15.57 | 15.57 | 15.57 | 15.57 |
| Depreciation | 1,970.5 | 2,130.9 | 2,444.9 | 2,810.3 | 3,390.0 | 3,441.8 | 3,905.6 | 4,431.9 | 5,029.1 | 5,706.8 |
| Depreciation, % | 3.1 | 2.74 | 2.66 | 2.77 | 3.25 | 2.9 | 2.9 | 2.9 | 2.9 | 2.9 |
| EBIT | 10,734.9 | 10,266.0 | 9,525.4 | 12,611.4 | 10,926.1 | 15,020.1 | 17,044.1 | 19,340.9 | 21,947.2 | 24,904.8 |
| EBIT, % | 16.89 | 13.21 | 10.35 | 12.44 | 10.46 | 12.67 | 12.67 | 12.67 | 12.67 | 12.67 |
| Total Cash | 7,615.1 | 5,201.3 | 7,484.0 | 11,786.6 | 9,441.2 | 11,255.5 | 12,772.3 | 14,493.4 | 16,446.5 | 18,662.8 |
| Total Cash, percent | .0 | .0 | .0 | .0 | .0 | .0 | .0 | .0 | .0 | .0 |
| Account Receivables | 3,899.0 | 4,668.1 | 4,923.8 | 5,114.4 | 5,401.0 | 6,569.2 | 7,454.4 | 8,458.9 | 9,598.8 | 10,892.3 |
| Account Receivables, % | 6.14 | 6.01 | 5.35 | 5.05 | 5.17 | 5.54 | 5.54 | 5.54 | 5.54 | 5.54 |
| Inventories | 7,607.7 | 12,601.6 | 13,856.4 | 13,585.9 | 13,336.5 | 16,456.7 | 18,674.4 | 21,190.9 | 24,046.5 | 27,286.9 |
| Inventories, % | 11.97 | 16.21 | 15.06 | 13.41 | 12.77 | 13.88 | 13.88 | 13.88 | 13.88 | 13.88 |
| Accounts Payable | 6,461.6 | 7,940.1 | 9,037.5 | 10,155.8 | 8,934.4 | 11,564.3 | 13,122.7 | 14,891.0 | 16,897.7 | 19,174.8 |
| Accounts Payable, % | 10.17 | 10.22 | 9.82 | 10.02 | 8.55 | 9.76 | 9.76 | 9.76 | 9.76 | 9.76 |
| Capital Expenditure | -2,266.0 | -4,699.4 | -4,243.3 | -5,493.4 | -8,904.4 | -6,678.0 | -7,577.9 | -8,599.0 | -9,757.8 | -11,072.7 |
| Capital Expenditure, % | -3.57 | -6.05 | -4.61 | -5.42 | -8.52 | -5.63 | -5.63 | -5.63 | -5.63 | -5.63 |
| Tax Rate, % | 22.45 | 22.45 | 22.45 | 22.45 | 22.45 | 22.45 | 22.45 | 22.45 | 22.45 | 22.45 |
| EBITAT | 8,662.0 | 8,071.3 | 7,417.2 | 9,599.3 | 8,473.3 | 11,741.1 | 13,323.3 | 15,118.6 | 17,156.0 | 19,467.9 |
| Depreciation | ||||||||||
| Changes in Account Receivables | ||||||||||
| Changes in Inventories | ||||||||||
| Changes in Accounts Payable | ||||||||||
| Capital Expenditure | ||||||||||
| UFCF | 3,321.4 | 1,218.3 | 5,205.7 | 8,114.4 | 1,700.3 | 6,846.4 | 8,106.4 | 9,198.8 | 10,438.4 | 11,845.1 |
| WACC, % | 5.24 | 5.24 | 5.24 | 5.24 | 5.24 | 5.24 | 5.24 | 5.24 | 5.24 | 5.24 |
| PV UFCF | ||||||||||
| SUM PV UFCF | 39,406.6 | |||||||||
| Long Term Growth Rate, % | 4.00 | |||||||||
| Free cash flow (T + 1) | 12,319 | |||||||||
| Terminal Value | 996,550 | |||||||||
| Present Terminal Value | 772,101 | |||||||||
| Enterprise Value | 811,508 | |||||||||
| Net Debt | -8,683 | |||||||||
| Equity Value | 820,191 | |||||||||
| Diluted Shares Outstanding, MM | 127 | |||||||||
| Equity Value Per Share | 6,456.82 |
What You Will Receive
- Accurate SUPREMEINDNS Financials: Offers comprehensive historical and projected data for precise valuations.
- Customizable Inputs: Adjust WACC, tax rates, revenue growth rates, and capital expenditures as needed.
- Automated Calculations: Intrinsic value and NPV are generated in real-time.
- Scenario Analysis: Explore various scenarios to assess The Supreme Industries Limited's future performance.
- User-Friendly Design: Designed for industry professionals while remaining accessible to newcomers.
Key Features
- Comprehensive DCF Calculator: Offers both unlevered and levered DCF valuation models tailored for Supreme Industries Limited (SUPREMEINDNS).
- WACC Calculator: Features a customizable Weighted Average Cost of Capital sheet for optimal analysis.
- Adjustable Forecast Assumptions: Easily modify growth rates, capital expenditures, and discount rates as needed.
- Integrated Financial Ratios: Evaluate key profitability, leverage, and efficiency ratios specifically for Supreme Industries Limited (SUPREMEINDNS).
- User-Friendly Dashboard and Charts: Visual representations of essential valuation metrics for streamlined analysis.
How It Works
- Step 1: Download the ready-to-use Excel template featuring The Supreme Industries Limited's (SUPREMEINDNS) data.
- Step 2: Navigate through the pre-filled sheets to familiarize yourself with the essential metrics.
- Step 3: Modify forecasts and assumptions in the highlighted yellow cells (WACC, growth rates, margins).
- Step 4: Immediately see the updated results, including the intrinsic value of The Supreme Industries Limited (SUPREMEINDNS).
- Step 5: Use the outputs to make informed investment choices or create detailed reports.
Why Choose This Calculator for Supreme Industries Limited (SUPREMEINDNS)?
- User-Friendly Interface: Perfectly suited for both novices and seasoned analysts.
- Customizable Parameters: Easily adjust inputs to tailor your financial analysis.
- Real-Time Feedback: Instantly observe changes to Supreme Industries' valuation as you modify inputs.
- Pre-Loaded Data: Comes equipped with Supreme Industries' actual financial information for seamless analysis.
- Endorsed by Experts: A preferred tool among investors and financial analysts for data-driven decision-making.
Who Can Benefit from This Product?
- Investors: Make informed investment choices with a top-tier valuation tool.
- Financial Analysts: Enhance efficiency with a customizable pre-built DCF model.
- Consultants: Effortlessly modify the template for client reports or presentations.
- Finance Enthusiasts: Expand your knowledge of valuation methods through practical examples.
- Educators and Students: Utilize it as a valuable resource for finance-related studies.
Discover more about The Supreme Industries Limited (SUPREMEINDNS) and how it can assist you today!
Contents of the Template
- Historical Data: Contains Supreme Industries Limited's previous financial performance and foundational forecasts.
- DCF and Levered DCF Models: Comprehensive templates for determining the intrinsic value of Supreme Industries Limited.
- WACC Sheet: Pre-configured calculations for the Weighted Average Cost of Capital.
- Editable Inputs: Adjust essential drivers such as growth rates, EBITDA percentages, and CAPEX assumptions.
- Quarterly and Annual Statements: A thorough analysis of Supreme Industries Limited's financials.
- Interactive Dashboard: Dynamically visualize valuation outcomes and future projections.
Disclaimer
All information, articles, and product details provided on this website are for general informational and educational purposes only. We do not claim any ownership over, nor do we intend to infringe upon, any trademarks, copyrights, logos, brand names, or other intellectual property mentioned or depicted on this site. Such intellectual property remains the property of its respective owners, and any references here are made solely for identification or informational purposes, without implying any affiliation, endorsement, or partnership.
We make no representations or warranties, express or implied, regarding the accuracy, completeness, or suitability of any content or products presented. Nothing on this website should be construed as legal, tax, investment, financial, medical, or other professional advice. In addition, no part of this site—including articles or product references—constitutes a solicitation, recommendation, endorsement, advertisement, or offer to buy or sell any securities, franchises, or other financial instruments, particularly in jurisdictions where such activity would be unlawful.
All content is of a general nature and may not address the specific circumstances of any individual or entity. It is not a substitute for professional advice or services. Any actions you take based on the information provided here are strictly at your own risk. You accept full responsibility for any decisions or outcomes arising from your use of this website and agree to release us from any liability in connection with your use of, or reliance upon, the content or products found herein.