
|
Southwest Gas Holdings, Inc. (SWX) Évaluation DCF |
Entièrement Modifiable: Adapté À Vos Besoins Dans Excel Ou Sheets
Conception Professionnelle: Modèles Fiables Et Conformes Aux Normes Du Secteur
Pré-Construits Pour Une Utilisation Rapide Et Efficace
Compatible MAC/PC, entièrement débloqué
Aucune Expertise N'Est Requise; Facile À Suivre
Southwest Gas Holdings, Inc. (SWX) Bundle
Découvrez la vraie valeur de Southwest Gas Holdings, Inc. (SWX) avec notre calculatrice avancée DCF! Ajustez les hypothèses clés, explorez divers scénarios et évaluez comment les changements affectent l'évaluation de Southwest Gas Holdings, Inc. (SWX) - le tout dans un seul modèle Excel.
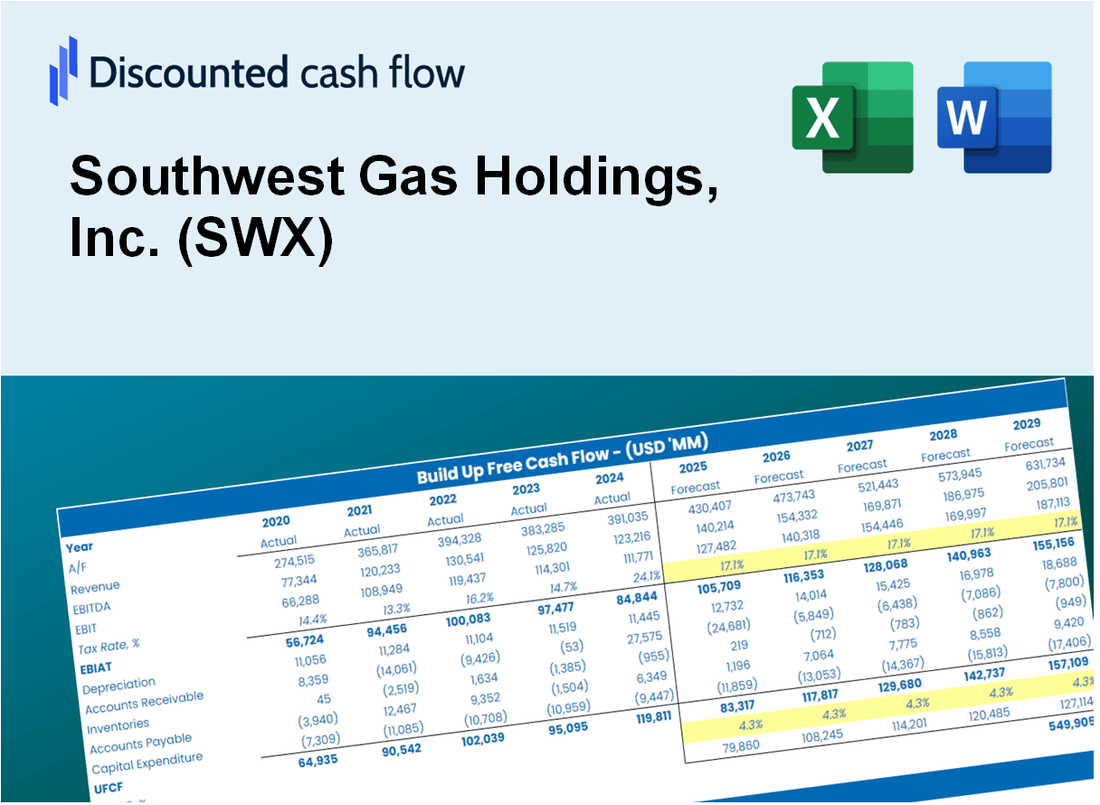
Discounted Cash Flow (DCF) - (USD MM)
| Year | AY1 2020 |
AY2 2021 |
AY3 2022 |
AY4 2023 |
AY5 2024 |
FY1 2025 |
FY2 2026 |
FY3 2027 |
FY4 2028 |
FY5 2029 |
|---|---|---|---|---|---|---|---|---|---|---|
| Revenue | 3,298.9 | 3,680.5 | 4,960.0 | 5,434.0 | 5,112.4 | 5,751.1 | 6,469.6 | 7,277.9 | 8,187.1 | 9,209.9 |
| Revenue Growth, % | 0 | 11.57 | 34.77 | 9.56 | -5.92 | 12.49 | 12.49 | 12.49 | 12.49 | 12.49 |
| EBITDA | 748.2 | 737.1 | 439.9 | 930.5 | 976.8 | 1,010.0 | 1,136.2 | 1,278.1 | 1,437.8 | 1,617.4 |
| EBITDA, % | 22.68 | 20.03 | 8.87 | 17.12 | 19.11 | 17.56 | 17.56 | 17.56 | 17.56 | 17.56 |
| Depreciation | 332.0 | 371.0 | 470.5 | 440.9 | 438.4 | 532.8 | 599.4 | 674.2 | 758.5 | 853.2 |
| Depreciation, % | 10.06 | 10.08 | 9.48 | 8.11 | 8.58 | 9.26 | 9.26 | 9.26 | 9.26 | 9.26 |
| EBIT | 416.2 | 366.0 | -30.6 | 489.6 | 538.3 | 477.2 | 536.8 | 603.9 | 679.3 | 764.2 |
| EBIT, % | 12.62 | 9.95 | -0.61667 | 9.01 | 10.53 | 8.3 | 8.3 | 8.3 | 8.3 | 8.3 |
| Total Cash | 83.4 | 222.7 | 123.1 | 106.5 | 363.8 | 231.6 | 260.5 | 293.1 | 329.7 | 370.9 |
| Total Cash, percent | .0 | .0 | .0 | .0 | .0 | .0 | .0 | .0 | .0 | .0 |
| Account Receivables | 615.5 | 808.8 | 963.1 | 981.5 | 821.6 | 1,083.3 | 1,218.7 | 1,370.9 | 1,542.2 | 1,734.8 |
| Account Receivables, % | 18.66 | 21.98 | 19.42 | 18.06 | 16.07 | 18.84 | 18.84 | 18.84 | 18.84 | 18.84 |
| Inventories | .0 | .0 | .0 | .0 | .0 | .0 | .0 | .0 | .0 | .0 |
| Inventories, % | 0 | 0 | 0 | 0 | 0 | 0 | 0 | 0 | 0 | 0 |
| Accounts Payable | 231.3 | 353.4 | 662.1 | 346.9 | 331.8 | 492.7 | 554.3 | 623.5 | 701.4 | 789.0 |
| Accounts Payable, % | 7.01 | 9.6 | 13.35 | 6.38 | 6.49 | 8.57 | 8.57 | 8.57 | 8.57 | 8.57 |
| Capital Expenditure | -825.1 | -715.6 | -859.4 | -872.5 | -945.9 | -1,108.2 | -1,246.6 | -1,402.3 | -1,577.5 | -1,774.6 |
| Capital Expenditure, % | -25.01 | -19.44 | -17.33 | -16.06 | -18.5 | -19.27 | -19.27 | -19.27 | -19.27 | -19.27 |
| Tax Rate, % | 17.61 | 17.61 | 17.61 | 17.61 | 17.61 | 17.61 | 17.61 | 17.61 | 17.61 | 17.61 |
| EBITAT | 317.3 | 297.7 | -22.7 | 374.4 | 443.6 | 373.0 | 419.6 | 472.0 | 530.9 | 597.3 |
| Depreciation | ||||||||||
| Changes in Account Receivables | ||||||||||
| Changes in Inventories | ||||||||||
| Changes in Accounts Payable | ||||||||||
| Capital Expenditure | ||||||||||
| UFCF | -559.9 | -118.2 | -257.2 | -390.8 | 80.8 | -303.2 | -301.5 | -339.1 | -381.5 | -429.1 |
| WACC, % | 5.66 | 5.8 | 5.61 | 5.67 | 5.83 | 5.71 | 5.71 | 5.71 | 5.71 | 5.71 |
| PV UFCF | ||||||||||
| SUM PV UFCF | -1,474.1 | |||||||||
| Long Term Growth Rate, % | 2.00 | |||||||||
| Free cash flow (T + 1) | -438 | |||||||||
| Terminal Value | -11,785 | |||||||||
| Present Terminal Value | -8,926 | |||||||||
| Enterprise Value | -10,400 | |||||||||
| Net Debt | 4,695 | |||||||||
| Equity Value | -15,095 | |||||||||
| Diluted Shares Outstanding, MM | 72 | |||||||||
| Equity Value Per Share | -209.56 |
What You Will Get
- Real Southwest Gas Data: Preloaded financials – from revenue to EBIT – based on actual and projected figures.
- Full Customization: Adjust all critical parameters (yellow cells) like WACC, growth %, and tax rates.
- Instant Valuation Updates: Automatic recalculations to analyze the impact of changes on Southwest Gas Holdings’ fair value.
- Versatile Excel Template: Tailored for quick edits, scenario testing, and detailed projections.
- Time-Saving and Accurate: Skip building models from scratch while maintaining precision and flexibility.
Key Features
- Comprehensive Financial Data: Access Southwest Gas Holdings, Inc.'s historical financial statements and pre-filled projections.
- Customizable Parameters: Modify WACC, tax rates, revenue growth, and EBITDA margins as needed.
- Real-Time Valuation: Observe the recalculation of Southwest Gas Holdings, Inc.'s intrinsic value instantly.
- Intuitive Visualizations: Dashboard graphs illustrate valuation outcomes and essential metrics.
- Designed for Precision: A robust tool tailored for analysts, investors, and finance professionals.
How It Works
- Download the Template: Gain immediate access to the Excel-based SWX DCF Calculator.
- Input Your Assumptions: Modify the yellow-highlighted cells for growth rates, WACC, margins, and additional parameters.
- Instant Calculations: The model automatically recalculates Southwest Gas Holdings' intrinsic value.
- Test Scenarios: Experiment with various assumptions to assess potential changes in valuation.
- Analyze and Decide: Utilize the outcomes to inform your investment or financial analysis.
Why Choose This Calculator?
- User-Friendly Interface: Perfect for both novice and experienced users.
- Customizable Inputs: Easily adjust parameters to suit your financial analysis.
- Real-Time Feedback: Observe immediate changes to Southwest Gas Holdings, Inc.'s (SWX) valuation as you tweak inputs.
- Pre-Loaded Data: Comes equipped with Southwest Gas Holdings, Inc.'s (SWX) actual financial metrics for swift evaluations.
- Relied Upon by Experts: Favored by investors and analysts for making well-informed choices.
Who Should Use This Product?
- Utility Management Students: Explore operational strategies and apply them to real-world scenarios.
- Researchers: Integrate industry-specific models into studies or academic papers.
- Investors: Validate your investment hypotheses and assess valuation metrics for Southwest Gas Holdings, Inc. (SWX).
- Financial Analysts: Enhance your efficiency with a ready-to-use, customizable DCF model tailored for utility companies.
- Entrepreneurs: Understand the evaluation methods used for large utility firms like Southwest Gas Holdings, Inc. (SWX).
What the Template Contains
- Operating and Balance Sheet Data: Pre-filled Southwest Gas Holdings, Inc. (SWX) historical data and forecasts, including revenue, EBITDA, EBIT, and capital expenditures.
- WACC Calculation: A dedicated sheet for Weighted Average Cost of Capital (WACC), including parameters like Beta, risk-free rate, and share price.
- DCF Valuation (Unlevered and Levered): Editable Discounted Cash Flow models showing intrinsic value with detailed calculations.
- Financial Statements: Pre-loaded financial statements (annual and quarterly) to support analysis.
- Key Ratios: Includes profitability, leverage, and efficiency ratios for Southwest Gas Holdings, Inc. (SWX).
- Dashboard and Charts: Visual summary of valuation outputs and assumptions to analyze results easily.
Disclaimer
All information, articles, and product details provided on this website are for general informational and educational purposes only. We do not claim any ownership over, nor do we intend to infringe upon, any trademarks, copyrights, logos, brand names, or other intellectual property mentioned or depicted on this site. Such intellectual property remains the property of its respective owners, and any references here are made solely for identification or informational purposes, without implying any affiliation, endorsement, or partnership.
We make no representations or warranties, express or implied, regarding the accuracy, completeness, or suitability of any content or products presented. Nothing on this website should be construed as legal, tax, investment, financial, medical, or other professional advice. In addition, no part of this site—including articles or product references—constitutes a solicitation, recommendation, endorsement, advertisement, or offer to buy or sell any securities, franchises, or other financial instruments, particularly in jurisdictions where such activity would be unlawful.
All content is of a general nature and may not address the specific circumstances of any individual or entity. It is not a substitute for professional advice or services. Any actions you take based on the information provided here are strictly at your own risk. You accept full responsibility for any decisions or outcomes arising from your use of this website and agree to release us from any liability in connection with your use of, or reliance upon, the content or products found herein.