
|
SYPRIS SOLUTIONS, Inc. (SYPR) Évaluation DCF |
Entièrement Modifiable: Adapté À Vos Besoins Dans Excel Ou Sheets
Conception Professionnelle: Modèles Fiables Et Conformes Aux Normes Du Secteur
Pré-Construits Pour Une Utilisation Rapide Et Efficace
Compatible MAC/PC, entièrement débloqué
Aucune Expertise N'Est Requise; Facile À Suivre
Sypris Solutions, Inc. (SYPR) Bundle
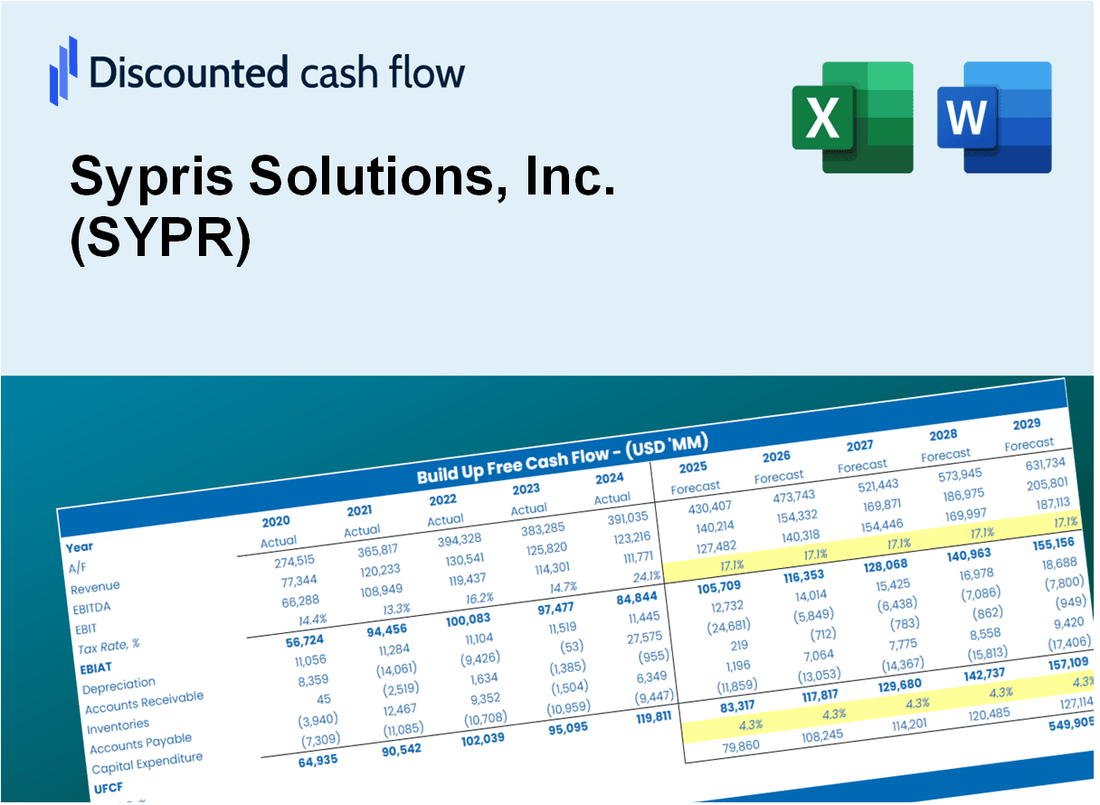
Explorez les perspectives financières de Syprim Solutions, Inc. (SYPR) avec notre calculatrice DCF conviviale! Entrez vos projections pour la croissance, les marges et les dépenses pour calculer la valeur intrinsèque de Sypring Solutions, Inc. (SYPR) et façonnez votre approche d'investissement.
What You Will Receive
- Flexible Forecast Inputs: Modify key assumptions (growth %, margins, WACC) to generate various scenarios.
- Industry-Specific Data: Sypris Solutions, Inc.'s (SYPR) financial data pre-loaded to enhance your analysis.
- Automated DCF Outputs: The template computes Net Present Value (NPV) and intrinsic value automatically.
- Tailorable and Professional: A refined Excel model that adjusts to your valuation requirements.
- Designed for Analysts and Investors: Perfect for assessing projections, validating strategies, and optimizing efficiency.
Key Features
- Comprehensive SYPR Data: Pre-loaded with Sypris Solutions’ historical performance and future projections.
- Customizable Financial Inputs: Modify revenue growth rates, profit margins, WACC, tax rates, and capital expenditures as needed.
- Interactive Valuation Model: Automatically refreshes Net Present Value (NPV) and intrinsic value based on your adjustments.
- Scenario Analysis: Develop various forecasting scenarios to evaluate different valuation possibilities.
- Intuitive User Interface: Designed for ease of use, suitable for both experienced professionals and newcomers.
How It Works
- Step 1: Download the prebuilt Excel template containing Sypris Solutions, Inc. (SYPR) data.
- Step 2: Review the pre-filled sheets to familiarize yourself with the essential metrics.
- Step 3: Modify forecasts and assumptions in the editable yellow cells (WACC, growth, margins).
- Step 4: Instantly see the recalculated results, including Sypris Solutions, Inc.'s (SYPR) intrinsic value.
- Step 5: Utilize the outputs to make informed investment decisions or create detailed reports.
Why Choose This Calculator for Sypris Solutions, Inc. (SYPR)?
- User-Friendly Interface: Tailored for both novices and seasoned professionals.
- Customizable Inputs: Adjust parameters easily to suit your financial analysis.
- Real-Time Valuation: Observe immediate updates to Sypris Solutions' valuation as you change inputs.
- Preloaded Data: Comes with Sypris Solutions' actual financial metrics for quick evaluations.
- Preferred by Experts: Valued by investors and analysts for making educated decisions.
Who Should Use This Product?
- Professional Investors: Develop comprehensive valuation models for in-depth portfolio assessments of Sypris Solutions, Inc. (SYPR).
- Corporate Finance Teams: Evaluate valuation scenarios to inform strategic decisions within the organization.
- Consultants and Advisors: Deliver precise valuation insights to clients investing in Sypris Solutions, Inc. (SYPR).
- Students and Educators: Utilize real-world data to enhance learning and practice in financial modeling.
- Industry Analysts: Gain insights into the market valuation of specialized technology and solutions providers like Sypris Solutions, Inc. (SYPR).
What the Template Contains
- Operating and Balance Sheet Data: Pre-filled Sypris Solutions historical data and forecasts, including revenue, EBITDA, EBIT, and capital expenditures.
- WACC Calculation: A dedicated sheet for Weighted Average Cost of Capital (WACC), including parameters like Beta, risk-free rate, and share price.
- DCF Valuation (Unlevered and Levered): Editable Discounted Cash Flow models showing intrinsic value with detailed calculations.
- Financial Statements: Pre-loaded financial statements (annual and quarterly) to support analysis.
- Key Ratios: Includes profitability, leverage, and efficiency ratios for Sypris Solutions, Inc. (SYPR).
- Dashboard and Charts: Visual summary of valuation outputs and assumptions to analyze results easily.
Disclaimer
All information, articles, and product details provided on this website are for general informational and educational purposes only. We do not claim any ownership over, nor do we intend to infringe upon, any trademarks, copyrights, logos, brand names, or other intellectual property mentioned or depicted on this site. Such intellectual property remains the property of its respective owners, and any references here are made solely for identification or informational purposes, without implying any affiliation, endorsement, or partnership.
We make no representations or warranties, express or implied, regarding the accuracy, completeness, or suitability of any content or products presented. Nothing on this website should be construed as legal, tax, investment, financial, medical, or other professional advice. In addition, no part of this site—including articles or product references—constitutes a solicitation, recommendation, endorsement, advertisement, or offer to buy or sell any securities, franchises, or other financial instruments, particularly in jurisdictions where such activity would be unlawful.
All content is of a general nature and may not address the specific circumstances of any individual or entity. It is not a substitute for professional advice or services. Any actions you take based on the information provided here are strictly at your own risk. You accept full responsibility for any decisions or outcomes arising from your use of this website and agree to release us from any liability in connection with your use of, or reliance upon, the content or products found herein.