
|
Tata Steel Limited (Tatasteel.NS) Évaluation DCF |
Entièrement Modifiable: Adapté À Vos Besoins Dans Excel Ou Sheets
Conception Professionnelle: Modèles Fiables Et Conformes Aux Normes Du Secteur
Pré-Construits Pour Une Utilisation Rapide Et Efficace
Compatible MAC/PC, entièrement débloqué
Aucune Expertise N'Est Requise; Facile À Suivre
Tata Steel Limited (TATASTEEL.NS) Bundle
Vous cherchez à évaluer la valeur intrinsèque de Tata Steel Limited? Notre calculatrice DCF (Tatasteelns) fusionne les données du monde réel avec des options de personnalisation approfondies, vous permettant d'ajuster les prévisions et d'améliorer vos stratégies d'investissement.
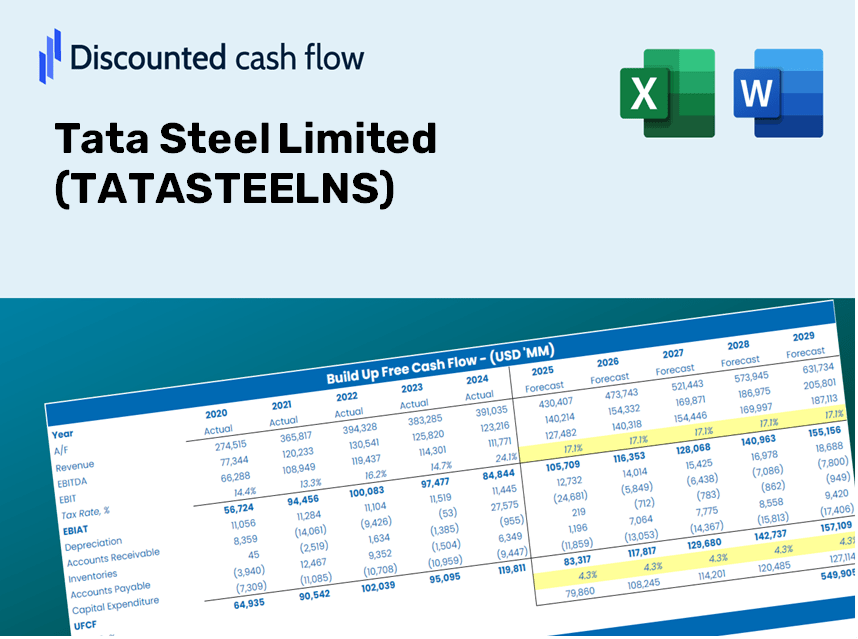
Discounted Cash Flow (DCF) - (USD MM)
| Year | AY1 2021 |
AY2 2022 |
AY3 2023 |
AY4 2024 |
AY5 2025 |
FY1 2026 |
FY2 2027 |
FY3 2028 |
FY4 2029 |
FY5 2030 |
|---|---|---|---|---|---|---|---|---|---|---|
| Revenue | 1,564,774.0 | 2,439,591.7 | 2,433,526.9 | 2,291,707.8 | 2,185,425.1 | 2,215,914.5 | 2,246,829.3 | 2,278,175.4 | 2,309,958.9 | 2,342,185.7 |
| Revenue Growth, % | 0 | 55.91 | -0.2486 | -5.83 | -4.64 | 1.4 | 1.4 | 1.4 | 1.4 | 1.4 |
| EBITDA | 275,128.5 | 637,201.8 | 296,495.0 | 212,879.6 | 239,646.6 | 337,441.2 | 342,148.9 | 346,922.3 | 351,762.3 | 356,669.9 |
| EBITDA, % | 17.58 | 26.12 | 12.18 | 9.29 | 10.97 | 15.23 | 15.23 | 15.23 | 15.23 | 15.23 |
| Depreciation | 80,185.4 | 79,982.4 | 83,347.3 | 89,019.6 | 95,070.7 | 88,913.7 | 90,154.1 | 91,411.9 | 92,687.2 | 93,980.3 |
| Depreciation, % | 5.12 | 3.28 | 3.42 | 3.88 | 4.35 | 4.01 | 4.01 | 4.01 | 4.01 | 4.01 |
| EBIT | 194,943.1 | 557,219.4 | 213,147.7 | 123,860.0 | 144,575.9 | 248,527.5 | 251,994.8 | 255,510.5 | 259,075.1 | 262,689.6 |
| EBIT, % | 12.46 | 22.84 | 8.76 | 5.4 | 6.62 | 11.22 | 11.22 | 11.22 | 11.22 | 11.22 |
| Total Cash | 141,416.1 | 260,792.1 | 184,228.3 | 88,550.1 | 100,476.1 | 158,479.5 | 160,690.4 | 162,932.3 | 165,205.4 | 167,510.2 |
| Total Cash, percent | .0 | .0 | .0 | .0 | .0 | .0 | .0 | .0 | .0 | .0 |
| Account Receivables | 95,757.6 | 122,810.4 | 82,939.9 | 63,407.8 | 52,650.4 | 87,474.8 | 88,695.2 | 89,932.6 | 91,187.2 | 92,459.4 |
| Account Receivables, % | 6.12 | 5.03 | 3.41 | 2.77 | 2.41 | 3.95 | 3.95 | 3.95 | 3.95 | 3.95 |
| Inventories | 332,763.8 | 488,243.9 | 544,153.3 | 491,575.1 | 445,899.4 | 467,529.0 | 474,051.6 | 480,665.2 | 487,371.1 | 494,170.5 |
| Inventories, % | 21.27 | 20.01 | 22.36 | 21.45 | 20.4 | 21.1 | 21.1 | 21.1 | 21.1 | 21.1 |
| Accounts Payable | 78,392.3 | 91,913.1 | 99,318.1 | 354,346.6 | 293,143.8 | 184,959.4 | 187,539.8 | 190,156.2 | 192,809.1 | 195,499.1 |
| Accounts Payable, % | 5.01 | 3.77 | 4.08 | 15.46 | 13.41 | 8.35 | 8.35 | 8.35 | 8.35 | 8.35 |
| Capital Expenditure | -69,785.9 | -105,222.0 | -141,424.9 | -182,066.0 | -156,705.2 | -131,622.9 | -133,459.2 | -135,321.1 | -137,209.0 | -139,123.2 |
| Capital Expenditure, % | -4.46 | -4.31 | -5.81 | -7.94 | -7.17 | -5.94 | -5.94 | -5.94 | -5.94 | -5.94 |
| Tax Rate, % | 59.34 | 59.34 | 59.34 | 59.34 | 59.34 | 59.34 | 59.34 | 59.34 | 59.34 | 59.34 |
| EBITAT | 105,475.3 | 445,469.7 | 102,399.1 | 479,164.9 | 58,781.8 | 160,424.6 | 162,662.7 | 164,932.1 | 167,233.1 | 169,566.2 |
| Depreciation | ||||||||||
| Changes in Account Receivables | ||||||||||
| Changes in Inventories | ||||||||||
| Changes in Accounts Payable | ||||||||||
| Capital Expenditure | ||||||||||
| UFCF | -234,254.3 | 251,218.0 | 35,687.6 | 713,257.3 | -7,622.4 | -46,923.0 | 114,195.1 | 115,788.3 | 117,403.7 | 119,041.6 |
| WACC, % | 6.52 | 7.13 | 6.37 | 7.6 | 6.2 | 6.76 | 6.76 | 6.76 | 6.76 | 6.76 |
| PV UFCF | ||||||||||
| SUM PV UFCF | 327,585.1 | |||||||||
| Long Term Growth Rate, % | 3.50 | |||||||||
| Free cash flow (T + 1) | 123,208 | |||||||||
| Terminal Value | 3,777,465 | |||||||||
| Present Terminal Value | 2,723,478 | |||||||||
| Enterprise Value | 3,051,063 | |||||||||
| Net Debt | 851,961 | |||||||||
| Equity Value | 2,199,102 | |||||||||
| Diluted Shares Outstanding, MM | 12,484 | |||||||||
| Equity Value Per Share | 176.16 |
What You Will Receive
- Pre-Filled Financial Model: Utilizing Tata Steel's actual data for accurate DCF valuation.
- Comprehensive Forecast Control: Modify revenue growth, profit margins, WACC, and other critical variables.
- Real-Time Calculations: Automatic updates provide immediate insights as you adjust inputs.
- Professional-Grade Template: A polished Excel model designed for investor-ready valuations.
- Customizable and Reusable: Engineered for adaptability, making it easy to conduct detailed forecasts repeatedly.
Key Features
- Customizable Forecast Inputs: Adjust essential parameters such as revenue growth, EBITDA margins, and capital expenditures.
- Instant DCF Valuation: Quickly computes intrinsic value, net present value (NPV), and other financial metrics.
- High-Precision Accuracy: Leverages Tata Steel Limited’s (TATASTEELNS) actual financial data for credible valuation results.
- Effortless Scenario Analysis: Easily explore various assumptions and analyze their impacts side-by-side.
- Efficiency Booster: Remove the hassle of constructing intricate valuation models from the ground up.
How It Works
- Step 1: Download the pre-built Excel template containing Tata Steel Limited’s data.
- Step 2: Review the pre-filled worksheets to familiarize yourself with the essential metrics.
- Step 3: Modify the forecasts and assumptions in the editable yellow cells (WACC, growth, margins).
- Step 4: Immediately see updated results, including Tata Steel Limited’s intrinsic value.
- Step 5: Use the outputs to make informed investment decisions or create reports.
Why Choose This Calculator for Tata Steel Limited (TATASTEELNS)?
- All-in-One Solution: Offers DCF, WACC, and financial ratio analyses seamlessly integrated.
- Flexible Inputs: Modify the yellow-highlighted fields to explore different scenarios.
- In-Depth Analysis: Automatically computes Tata Steel's intrinsic value and Net Present Value.
- Preloaded Information: Comes with historical and projected data for precise evaluations.
- Professional Standard: Perfect for financial analysts, investors, and business consultants.
Who Can Benefit from Tata Steel Limited (TATASTEELNS)?
- Investors: Gain assurance in your investment choices with a top-tier valuation tool.
- Financial Analysts: Streamline your workflow using a customizable, ready-to-use DCF model.
- Consultants: Effortlessly tailor the template for client presentations or detailed reports.
- Finance Enthusiasts: Enhance your knowledge of valuation methods through practical, real-world examples.
- Educators and Students: Leverage this resource as a hands-on tool in finance courses.
Contents of the Template
- Operating and Balance Sheet Data: Pre-filled historical data and forecasts for Tata Steel Limited (TATASTEELNS), encompassing revenue, EBITDA, EBIT, and capital expenditures.
- WACC Calculation: A dedicated sheet for the Weighted Average Cost of Capital (WACC), featuring parameters such as Beta, risk-free rate, and share price.
- DCF Valuation (Unlevered and Levered): Customizable Discounted Cash Flow models that illustrate intrinsic value with comprehensive calculations.
- Financial Statements: Pre-loaded financial statements (annual and quarterly) to aid in analysis.
- Key Ratios: Provides profitability, leverage, and efficiency ratios for Tata Steel Limited (TATASTEELNS).
- Dashboard and Charts: A visual overview of valuation outputs and assumptions, designed for easy analysis of results.
Disclaimer
All information, articles, and product details provided on this website are for general informational and educational purposes only. We do not claim any ownership over, nor do we intend to infringe upon, any trademarks, copyrights, logos, brand names, or other intellectual property mentioned or depicted on this site. Such intellectual property remains the property of its respective owners, and any references here are made solely for identification or informational purposes, without implying any affiliation, endorsement, or partnership.
We make no representations or warranties, express or implied, regarding the accuracy, completeness, or suitability of any content or products presented. Nothing on this website should be construed as legal, tax, investment, financial, medical, or other professional advice. In addition, no part of this site—including articles or product references—constitutes a solicitation, recommendation, endorsement, advertisement, or offer to buy or sell any securities, franchises, or other financial instruments, particularly in jurisdictions where such activity would be unlawful.
All content is of a general nature and may not address the specific circumstances of any individual or entity. It is not a substitute for professional advice or services. Any actions you take based on the information provided here are strictly at your own risk. You accept full responsibility for any decisions or outcomes arising from your use of this website and agree to release us from any liability in connection with your use of, or reliance upon, the content or products found herein.