
|
Tata Technologies Limited (Tatatech.NS) Évaluation DCF |
Entièrement Modifiable: Adapté À Vos Besoins Dans Excel Ou Sheets
Conception Professionnelle: Modèles Fiables Et Conformes Aux Normes Du Secteur
Pré-Construits Pour Une Utilisation Rapide Et Efficace
Compatible MAC/PC, entièrement débloqué
Aucune Expertise N'Est Requise; Facile À Suivre
Tata Technologies Limited (TATATECH.NS) Bundle
Améliorez vos stratégies d'investissement avec la calculatrice DCF (TatateChns)! Explorez les finances Authentic Tata Technologies limitées, ajustez les projections et dépenses de croissance et observez instantanément comment ces modifications affectent la valeur intrinsèque (TatateChns).
What You Will Gain
- Adjustable Forecast Inputs: Seamlessly modify key assumptions (growth %, margins, WACC) to explore various scenarios.
- Real-World Data: Tata Technologies Limited’s (TATATECHNS) financial data pre-loaded to expedite your analysis.
- Automated DCF Outputs: The template computes Net Present Value (NPV) and intrinsic value automatically.
- Customizable and Professional Design: A refined Excel model tailored to meet your valuation requirements.
- Designed for Analysts and Investors: Perfect for evaluating projections, confirming strategies, and enhancing efficiency.
Key Features
- Advanced DCF Calculator: Comprehensive unlevered and levered DCF valuation models tailored for Tata Technologies Limited (TATATECHNS).
- WACC Calculator: Customizable Weighted Average Cost of Capital sheet designed specifically for your financial needs.
- Editable Forecast Assumptions: Easily adjust growth rates, capital expenditures, and discount rates to suit your analysis.
- Built-In Financial Ratios: Evaluate profitability, leverage, and efficiency ratios for Tata Technologies Limited (TATATECHNS).
- Dashboard and Charts: User-friendly visual summaries of key valuation metrics facilitate straightforward analysis.
How It Works
- Step 1: Download the prebuilt Excel template featuring Tata Technologies Limited (TATATECHNS) data.
- Step 2: Navigate through the pre-filled sheets to familiarize yourself with the essential metrics.
- Step 3: Modify forecasts and assumptions in the editable yellow cells (WACC, growth rates, margins).
- Step 4: Instantly see recalculated results, including the intrinsic value of Tata Technologies Limited (TATATECHNS).
- Step 5: Utilize the outputs to make informed investment choices or create detailed reports.
Why Opt for Tata Technologies Limited (TATATECHNS) Calculator?
- Time-Saving: Skip the hassle of building a DCF model from the ground up – it's fully equipped and ready for use.
- Enhanced Accuracy: Dependable financial data and methodologies minimize valuation discrepancies.
- Completely Customizable: Adjust the model to align with your specific assumptions and forecasts.
- Simple to Understand: Intuitive charts and outputs facilitate straightforward analysis of results.
- Endorsed by Professionals: Created for experts who prioritize accuracy and user-friendliness.
Who Can Benefit from This Product?
- Investors: Effectively assess the fair value of Tata Technologies Limited (TATATECHNS) prior to making investment choices.
- CFOs: Utilize a professional-grade DCF model for comprehensive financial reporting and analysis.
- Consultants: Easily customize the template for client valuation reports.
- Entrepreneurs: Acquire insights into financial modeling practices employed by top companies.
- Educators: Implement this resource as a teaching aid to illustrate valuation techniques.
Contents of the Template
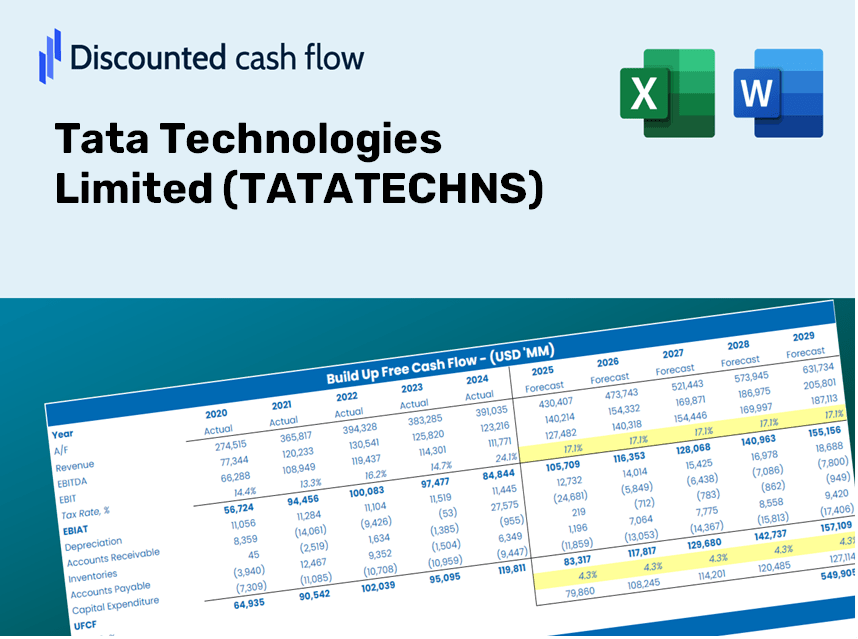
- Operating and Balance Sheet Data: Pre-filled historical data and forecasts for Tata Technologies Limited (TATATECHNS), including revenue, EBITDA, EBIT, and capital expenditures.
- WACC Calculation: A dedicated sheet for Weighted Average Cost of Capital (WACC), featuring key parameters such as Beta, risk-free rate, and share price.
- DCF Valuation (Unlevered and Levered): Customizable Discounted Cash Flow models illustrating intrinsic value with comprehensive calculations.
- Financial Statements: Pre-loaded annual and quarterly financial statements to aid in analysis.
- Key Ratios: Includes important profitability, leverage, and efficiency ratios for Tata Technologies Limited (TATATECHNS).
- Dashboard and Charts: Visual summaries of valuation outputs and assumptions for easy result analysis.
Disclaimer
All information, articles, and product details provided on this website are for general informational and educational purposes only. We do not claim any ownership over, nor do we intend to infringe upon, any trademarks, copyrights, logos, brand names, or other intellectual property mentioned or depicted on this site. Such intellectual property remains the property of its respective owners, and any references here are made solely for identification or informational purposes, without implying any affiliation, endorsement, or partnership.
We make no representations or warranties, express or implied, regarding the accuracy, completeness, or suitability of any content or products presented. Nothing on this website should be construed as legal, tax, investment, financial, medical, or other professional advice. In addition, no part of this site—including articles or product references—constitutes a solicitation, recommendation, endorsement, advertisement, or offer to buy or sell any securities, franchises, or other financial instruments, particularly in jurisdictions where such activity would be unlawful.
All content is of a general nature and may not address the specific circumstances of any individual or entity. It is not a substitute for professional advice or services. Any actions you take based on the information provided here are strictly at your own risk. You accept full responsibility for any decisions or outcomes arising from your use of this website and agree to release us from any liability in connection with your use of, or reliance upon, the content or products found herein.