
|
Tate & Lyle plc (Tate.L) Valation DCF |
Entièrement Modifiable: Adapté À Vos Besoins Dans Excel Ou Sheets
Conception Professionnelle: Modèles Fiables Et Conformes Aux Normes Du Secteur
Pré-Construits Pour Une Utilisation Rapide Et Efficace
Compatible MAC/PC, entièrement débloqué
Aucune Expertise N'Est Requise; Facile À Suivre
Tate & Lyle plc (TATE.L) Bundle
Faire des choix d'investissement éclairés avec la Tate & Calculatrice DCF Lyle PLC (TATEL)! Passez en revue les données financières authentiques, ajustez les projections et les dépenses de croissance et observez instantanément comment les modifications affectent la valeur intrinsèque de la Tate & Lyle plc (Tatel).
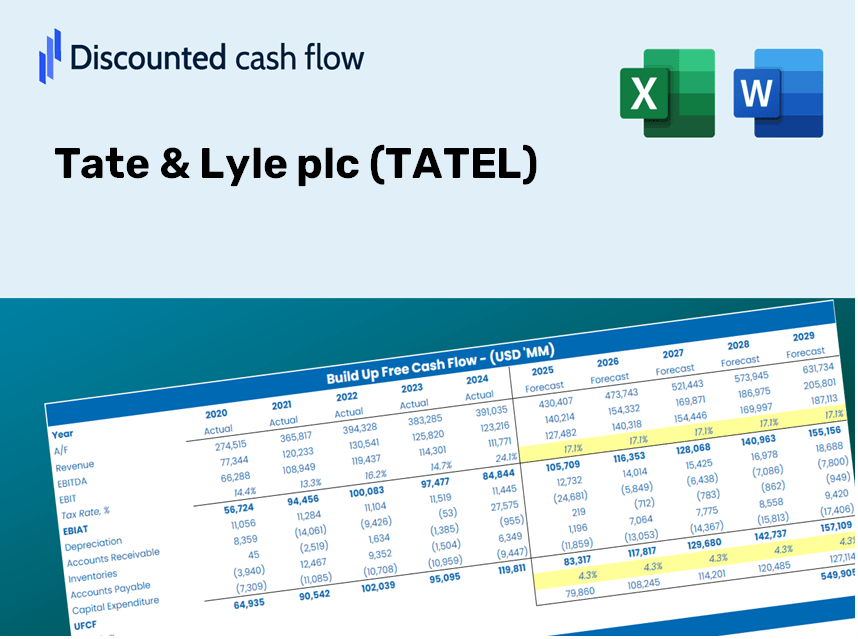
Discounted Cash Flow (DCF) - (USD MM)
| Year | AY1 2021 |
AY2 2022 |
AY3 2023 |
AY4 2024 |
AY5 2025 |
FY1 2026 |
FY2 2027 |
FY3 2028 |
FY4 2029 |
FY5 2030 |
|---|---|---|---|---|---|---|---|---|---|---|
| Revenue | 1,211.0 | 1,375.0 | 1,751.0 | 1,647.0 | 1,736.0 | 1,911.1 | 2,103.9 | 2,316.2 | 2,549.8 | 2,807.1 |
| Revenue Growth, % | 0 | 13.54 | 27.35 | -5.94 | 5.4 | 10.09 | 10.09 | 10.09 | 10.09 | 10.09 |
| EBITDA | 292.0 | 168.0 | 279.0 | 345.0 | 254.0 | 335.8 | 369.6 | 406.9 | 448.0 | 493.2 |
| EBITDA, % | 24.11 | 12.22 | 15.93 | 20.95 | 14.63 | 17.57 | 17.57 | 17.57 | 17.57 | 17.57 |
| Depreciation | 175.0 | 100.0 | 95.0 | 94.0 | 128.0 | 153.8 | 169.3 | 186.4 | 205.2 | 225.9 |
| Depreciation, % | 14.45 | 7.27 | 5.43 | 5.71 | 7.37 | 8.05 | 8.05 | 8.05 | 8.05 | 8.05 |
| EBIT | 117.0 | 68.0 | 184.0 | 251.0 | 126.0 | 182.0 | 200.3 | 220.6 | 242.8 | 267.3 |
| EBIT, % | 9.66 | 4.95 | 10.51 | 15.24 | 7.26 | 9.52 | 9.52 | 9.52 | 9.52 | 9.52 |
| Total Cash | 371.0 | 112.0 | 475.0 | 437.0 | 334.0 | 426.9 | 469.9 | 517.3 | 569.5 | 627.0 |
| Total Cash, percent | .0 | .0 | .0 | .0 | .0 | .0 | .0 | .0 | .0 | .0 |
| Account Receivables | 295.0 | 223.0 | 278.0 | 233.0 | 391.0 | 355.9 | 391.9 | 431.4 | 474.9 | 522.8 |
| Account Receivables, % | 24.36 | 16.22 | 15.88 | 14.15 | 22.52 | 18.62 | 18.62 | 18.62 | 18.62 | 18.62 |
| Inventories | 532.0 | 317.0 | 446.0 | 353.0 | 581.0 | 563.2 | 620.1 | 682.6 | 751.5 | 827.3 |
| Inventories, % | 43.93 | 23.05 | 25.47 | 21.43 | 33.47 | 29.47 | 29.47 | 29.47 | 29.47 | 29.47 |
| Accounts Payable | 267.0 | 151.0 | 250.0 | 174.0 | 233.0 | 272.5 | 300.0 | 330.3 | 363.6 | 400.3 |
| Accounts Payable, % | 22.05 | 10.98 | 14.28 | 10.56 | 13.42 | 14.26 | 14.26 | 14.26 | 14.26 | 14.26 |
| Capital Expenditure | -152.0 | -148.0 | -78.0 | -110.0 | -121.0 | -158.3 | -174.3 | -191.9 | -211.2 | -232.5 |
| Capital Expenditure, % | -12.55 | -10.76 | -4.45 | -6.68 | -6.97 | -8.28 | -8.28 | -8.28 | -8.28 | -8.28 |
| Tax Rate, % | -62.5 | -62.5 | -62.5 | -62.5 | -62.5 | -62.5 | -62.5 | -62.5 | -62.5 | -62.5 |
| EBITAT | 328.9 | 382.1 | 230.0 | 208.8 | 204.8 | 175.9 | 193.6 | 213.1 | 234.6 | 258.3 |
| Depreciation | ||||||||||
| Changes in Account Receivables | ||||||||||
| Changes in Inventories | ||||||||||
| Changes in Accounts Payable | ||||||||||
| Capital Expenditure | ||||||||||
| UFCF | -208.1 | 505.1 | 162.0 | 254.8 | -115.3 | 263.6 | 123.4 | 135.8 | 149.5 | 164.6 |
| WACC, % | 4.57 | 4.57 | 4.57 | 4.29 | 4.57 | 4.52 | 4.52 | 4.52 | 4.52 | 4.52 |
| PV UFCF | ||||||||||
| SUM PV UFCF | 741.4 | |||||||||
| Long Term Growth Rate, % | 2.00 | |||||||||
| Free cash flow (T + 1) | 168 | |||||||||
| Terminal Value | 6,670 | |||||||||
| Present Terminal Value | 5,348 | |||||||||
| Enterprise Value | 6,089 | |||||||||
| Net Debt | 972 | |||||||||
| Equity Value | 5,117 | |||||||||
| Diluted Shares Outstanding, MM | 415 | |||||||||
| Equity Value Per Share | 1,232.15 |
What You Will Receive
- Authentic Tate & Lyle Data: Preloaded financials – spanning from revenue to EBIT – based on real and projected figures.
- Comprehensive Customization: Modify all essential parameters (yellow cells) such as WACC, growth %, and tax rates.
- Immediate Valuation Updates: Automatic recalculations to assess the effects of changes on Tate & Lyle’s fair value.
- Flexible Excel Template: Designed for swift edits, scenario analysis, and detailed forecasts.
- Efficient and Precise: Avoid the hassle of building models from scratch while ensuring accuracy and adaptability.
Key Features
- Real-Life TATE Data: Pre-filled with Tate & Lyle’s historical financials and forward-looking projections.
- Fully Customizable Inputs: Adjust revenue growth, margins, WACC, tax rates, and capital expenditures as needed.
- Dynamic Valuation Model: Automatic updates to Net Present Value (NPV) and intrinsic value reflecting your inputs.
- Scenario Testing: Develop various forecast scenarios to evaluate different valuation results.
- User-Friendly Design: Intuitive, structured, and crafted for both professionals and newcomers.
How It Works
- Step 1: Download the prebuilt Excel template featuring Tate & Lyle plc's (TATEL) data.
- Step 2: Review the pre-filled sheets to familiarize yourself with the key performance indicators.
- Step 3: Adjust forecasts and assumptions in the editable yellow cells (WACC, growth, margins).
- Step 4: Immediately see the recalculated results, including the intrinsic value of Tate & Lyle plc (TATEL).
- Step 5: Make well-informed investment choices or generate reports based on the output.
Why Choose This Calculator for Tate & Lyle plc (TATEL)?
- Reliable Data: Utilize accurate financial information from Tate & Lyle plc to achieve trustworthy valuation outcomes.
- Tailorable: Modify essential factors such as growth rates, WACC, and tax rates to align with your forecasts.
- Efficient: Pre-configured calculations save you the effort of starting from the ground up.
- Professional Quality: Crafted for investors, analysts, and consultants in the industry.
- Easy to Use: An intuitive design and clear, step-by-step guidance make it accessible for all users.
Who Should Use This Product?
- Individual Investors: Make informed choices regarding the purchase or sale of Tate & Lyle plc (TATEL) shares.
- Financial Analysts: Enhance valuation methodologies with accessible financial models tailored for Tate & Lyle plc (TATEL).
- Consultants: Provide clients with swift and precise valuation insights related to Tate & Lyle plc (TATEL).
- Business Owners: Gain insights into how major companies like Tate & Lyle plc (TATEL) are valued to inform your own business strategies.
- Finance Students: Develop valuation skills using real-world data and examples centered on Tate & Lyle plc (TATEL).
Overview of Template Features
- In-Depth DCF Model: Fully editable template featuring comprehensive valuation calculations.
- Actual Financial Data: Tate & Lyle plc’s (TATEL) historical and projected financial figures preloaded for thorough analysis.
- Adjustable Variables: Modify WACC, growth rates, and tax assumptions to explore different scenarios.
- Comprehensive Financial Statements: Detailed annual and quarterly breakdowns for enhanced insights.
- Essential Ratios: Integrated analysis for assessing profitability, efficiency, and leverage.
- Visual Dashboard: Interactive charts and tables for clear and actionable results.
Disclaimer
All information, articles, and product details provided on this website are for general informational and educational purposes only. We do not claim any ownership over, nor do we intend to infringe upon, any trademarks, copyrights, logos, brand names, or other intellectual property mentioned or depicted on this site. Such intellectual property remains the property of its respective owners, and any references here are made solely for identification or informational purposes, without implying any affiliation, endorsement, or partnership.
We make no representations or warranties, express or implied, regarding the accuracy, completeness, or suitability of any content or products presented. Nothing on this website should be construed as legal, tax, investment, financial, medical, or other professional advice. In addition, no part of this site—including articles or product references—constitutes a solicitation, recommendation, endorsement, advertisement, or offer to buy or sell any securities, franchises, or other financial instruments, particularly in jurisdictions where such activity would be unlawful.
All content is of a general nature and may not address the specific circumstances of any individual or entity. It is not a substitute for professional advice or services. Any actions you take based on the information provided here are strictly at your own risk. You accept full responsibility for any decisions or outcomes arising from your use of this website and agree to release us from any liability in connection with your use of, or reliance upon, the content or products found herein.