
|
TP ICAP Group Plc (TCAP.L) Évaluation DCF |
Entièrement Modifiable: Adapté À Vos Besoins Dans Excel Ou Sheets
Conception Professionnelle: Modèles Fiables Et Conformes Aux Normes Du Secteur
Pré-Construits Pour Une Utilisation Rapide Et Efficace
Compatible MAC/PC, entièrement débloqué
Aucune Expertise N'Est Requise; Facile À Suivre
TP ICAP Group PLC (TCAP.L) Bundle
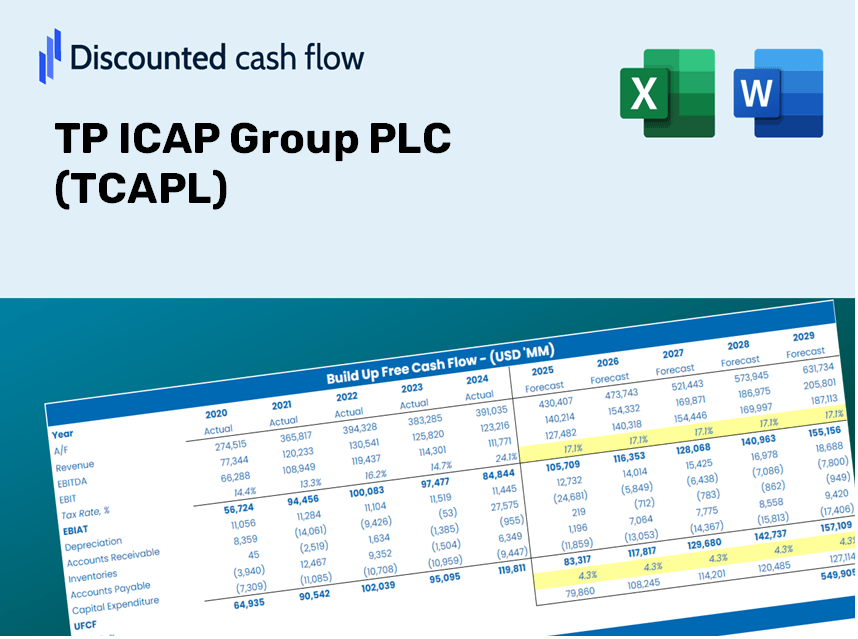
Que vous soyez un investisseur ou un analyste, cette calculatrice DCF TP ICAP Group PLC (TCAPL) est votre ressource incontournable pour des évaluations précises. Chargé de données réelles de TP ICAP Group PLC, vous pouvez ajuster les prévisions et observer instantanément les effets.
Discounted Cash Flow (DCF) - (USD MM)
| Year | AY1 2020 |
AY2 2021 |
AY3 2022 |
AY4 2023 |
AY5 2024 |
FY1 2025 |
FY2 2026 |
FY3 2027 |
FY4 2028 |
FY5 2029 |
|---|---|---|---|---|---|---|---|---|---|---|
| Revenue | 1,808.0 | 1,865.0 | 2,115.0 | 2,205.0 | 2,253.0 | 2,382.5 | 2,519.4 | 2,664.2 | 2,817.3 | 2,979.3 |
| Revenue Growth, % | 0 | 3.15 | 13.4 | 4.26 | 2.18 | 5.75 | 5.75 | 5.75 | 5.75 | 5.75 |
| EBITDA | 303.0 | 277.0 | 293.0 | 352.0 | 378.0 | 372.7 | 394.1 | 416.7 | 440.7 | 466.0 |
| EBITDA, % | 16.76 | 14.85 | 13.85 | 15.96 | 16.78 | 15.64 | 15.64 | 15.64 | 15.64 | 15.64 |
| Depreciation | 95.0 | 128.0 | 127.0 | 117.0 | 114.0 | 135.7 | 143.5 | 151.8 | 160.5 | 169.7 |
| Depreciation, % | 5.25 | 6.86 | 6 | 5.31 | 5.06 | 5.7 | 5.7 | 5.7 | 5.7 | 5.7 |
| EBIT | 208.0 | 149.0 | 166.0 | 235.0 | 264.0 | 236.9 | 250.5 | 264.9 | 280.1 | 296.2 |
| EBIT, % | 11.5 | 7.99 | 7.85 | 10.66 | 11.72 | 9.94 | 9.94 | 9.94 | 9.94 | 9.94 |
| Total Cash | .0 | 1,057.0 | 1,326.0 | 1,787.0 | 1,223.0 | 1,213.6 | 1,283.4 | 1,357.1 | 1,435.1 | 1,517.6 |
| Total Cash, percent | .0 | .0 | .0 | .0 | .0 | .0 | .0 | .0 | .0 | .0 |
| Account Receivables | 1,472.0 | 462.0 | 523.0 | 2,203.0 | 364.0 | 1,176.9 | 1,244.5 | 1,316.0 | 1,391.7 | 1,471.7 |
| Account Receivables, % | 81.42 | 24.77 | 24.73 | 99.91 | 16.16 | 49.4 | 49.4 | 49.4 | 49.4 | 49.4 |
| Inventories | .0 | .0 | .0 | .0 | .0 | .0 | .0 | .0 | .0 | .0 |
| Inventories, % | 0 | 0 | 0 | 0 | 0 | 0 | 0 | 0 | 0 | 0 |
| Accounts Payable | 22.0 | 17.0 | 24.0 | 40.0 | 39.0 | 32.4 | 34.3 | 36.3 | 38.4 | 40.6 |
| Accounts Payable, % | 1.22 | 0.91153 | 1.13 | 1.81 | 1.73 | 1.36 | 1.36 | 1.36 | 1.36 | 1.36 |
| Capital Expenditure | -53.0 | -58.0 | -53.0 | -12.0 | -9.0 | -45.2 | -47.8 | -50.6 | -53.5 | -56.6 |
| Capital Expenditure, % | -2.93 | -3.11 | -2.51 | -0.54422 | -0.39947 | -1.9 | -1.9 | -1.9 | -1.9 | -1.9 |
| Tax Rate, % | 28.33 | 28.33 | 28.33 | 28.33 | 28.33 | 28.33 | 28.33 | 28.33 | 28.33 | 28.33 |
| EBITAT | 137.7 | 24.0 | 120.4 | 149.9 | 189.2 | 137.6 | 145.5 | 153.8 | 162.7 | 172.0 |
| Depreciation | ||||||||||
| Changes in Account Receivables | ||||||||||
| Changes in Inventories | ||||||||||
| Changes in Accounts Payable | ||||||||||
| Capital Expenditure | ||||||||||
| UFCF | -1,270.3 | 1,099.0 | 140.4 | -1,409.1 | 2,132.2 | -591.3 | 175.4 | 185.5 | 196.2 | 207.4 |
| WACC, % | 5.73 | 4.7 | 5.87 | 5.68 | 5.85 | 5.57 | 5.57 | 5.57 | 5.57 | 5.57 |
| PV UFCF | ||||||||||
| SUM PV UFCF | 71.1 | |||||||||
| Long Term Growth Rate, % | 2.00 | |||||||||
| Free cash flow (T + 1) | 212 | |||||||||
| Terminal Value | 5,935 | |||||||||
| Present Terminal Value | 4,527 | |||||||||
| Enterprise Value | 4,598 | |||||||||
| Net Debt | -94 | |||||||||
| Equity Value | 4,692 | |||||||||
| Diluted Shares Outstanding, MM | 786 | |||||||||
| Equity Value Per Share | 597.16 |
What You Will Receive
- Customizable Excel Template: A fully adjustable Excel-based DCF Calculator featuring pre-populated financial data for TP ICAP Group PLC (TCAPL).
- Actual Financial Data: Historical figures and projected estimates (highlighted in the yellow cells).
- Assumption Flexibility: Adjust forecasting parameters such as revenue growth, EBITDA %, and WACC.
- Real-Time Calculations: Immediately observe how your inputs affect the valuation of TP ICAP Group PLC (TCAPL).
- Professional Resource: Designed for investors, CFOs, consultants, and financial analysts.
- Intuitive Layout: Organized for ease of understanding and use, complete with step-by-step guidance.
Key Features
- Comprehensive DCF Calculator: Features detailed unlevered and levered DCF valuation frameworks.
- WACC Calculator: Ready-to-use Weighted Average Cost of Capital template with adjustable inputs.
- Customizable Forecast Assumptions: Adjust growth projections, capital expenditures, and discount rates as needed.
- Integrated Financial Ratios: Evaluate profitability, leverage, and efficiency ratios for TP ICAP Group PLC (TCAPL).
- Interactive Dashboard and Charts: Visual representations highlight essential valuation metrics for straightforward analysis.
How It Works
- Step 1: Download the prebuilt Excel template containing TP ICAP Group PLC (TCAPL) data.
- Step 2: Review the pre-filled sheets to familiarize yourself with the essential metrics.
- Step 3: Adjust forecasts and assumptions in the editable yellow cells (WACC, growth, margins).
- Step 4: Immediately view updated results, including the intrinsic value of TP ICAP Group PLC (TCAPL).
- Step 5: Use the generated outputs to make informed investment decisions or create detailed reports.
Why Opt for This Calculator?
- Precise Information: Utilize authentic TP ICAP financial data for trustworthy valuation outcomes.
- Flexible Customization: Modify essential parameters such as growth rates, WACC, and tax rates to align with your forecasts.
- Efficiency Boost: Ready-made calculations save you from starting from the ground up.
- Professional-Quality Tool: Tailored for investors, analysts, and consultants in the field.
- Easy to Use: An intuitive design and clear, step-by-step guidance make it accessible for everyone.
Who Can Benefit from This Product?
- Investors: Evaluate TP ICAP Group PLC's (TCAPL) fair value effectively before making investment choices.
- CFOs: Utilize an advanced DCF model for precise financial reporting and analysis related to TP ICAP.
- Consultants: Easily modify the template to create valuation reports tailored for clients focused on TP ICAP.
- Entrepreneurs: Acquire valuable insights into the financial modeling practices of industry leaders like TP ICAP.
- Educators: Employ this resource as a teaching aid to illustrate various valuation methodologies using TP ICAP as a case study.
Overview of the Template Features
- In-Depth DCF Model: An editable template with extensive valuation calculations tailored for TP ICAP Group PLC (TCAPL).
- Current Data: Preloaded historical and projected financials for TP ICAP Group PLC (TCAPL) to facilitate thorough analysis.
- Flexible Parameters: Modify WACC, growth rates, and tax assumptions to explore various scenarios.
- Financial Statements: Complete annual and quarterly breakdowns offering deeper insights into performance.
- Essential Ratios: Integrated analysis for profitability, efficiency, and leverage metrics.
- Visual Dashboard: Engaging charts and tables presenting clear, actionable insights.
Disclaimer
All information, articles, and product details provided on this website are for general informational and educational purposes only. We do not claim any ownership over, nor do we intend to infringe upon, any trademarks, copyrights, logos, brand names, or other intellectual property mentioned or depicted on this site. Such intellectual property remains the property of its respective owners, and any references here are made solely for identification or informational purposes, without implying any affiliation, endorsement, or partnership.
We make no representations or warranties, express or implied, regarding the accuracy, completeness, or suitability of any content or products presented. Nothing on this website should be construed as legal, tax, investment, financial, medical, or other professional advice. In addition, no part of this site—including articles or product references—constitutes a solicitation, recommendation, endorsement, advertisement, or offer to buy or sell any securities, franchises, or other financial instruments, particularly in jurisdictions where such activity would be unlawful.
All content is of a general nature and may not address the specific circumstances of any individual or entity. It is not a substitute for professional advice or services. Any actions you take based on the information provided here are strictly at your own risk. You accept full responsibility for any decisions or outcomes arising from your use of this website and agree to release us from any liability in connection with your use of, or reliance upon, the content or products found herein.