
|
Tucows Inc. (TCX) Évaluation DCF |
Entièrement Modifiable: Adapté À Vos Besoins Dans Excel Ou Sheets
Conception Professionnelle: Modèles Fiables Et Conformes Aux Normes Du Secteur
Pré-Construits Pour Une Utilisation Rapide Et Efficace
Compatible MAC/PC, entièrement débloqué
Aucune Expertise N'Est Requise; Facile À Suivre
Tucows Inc. (TCX) Bundle
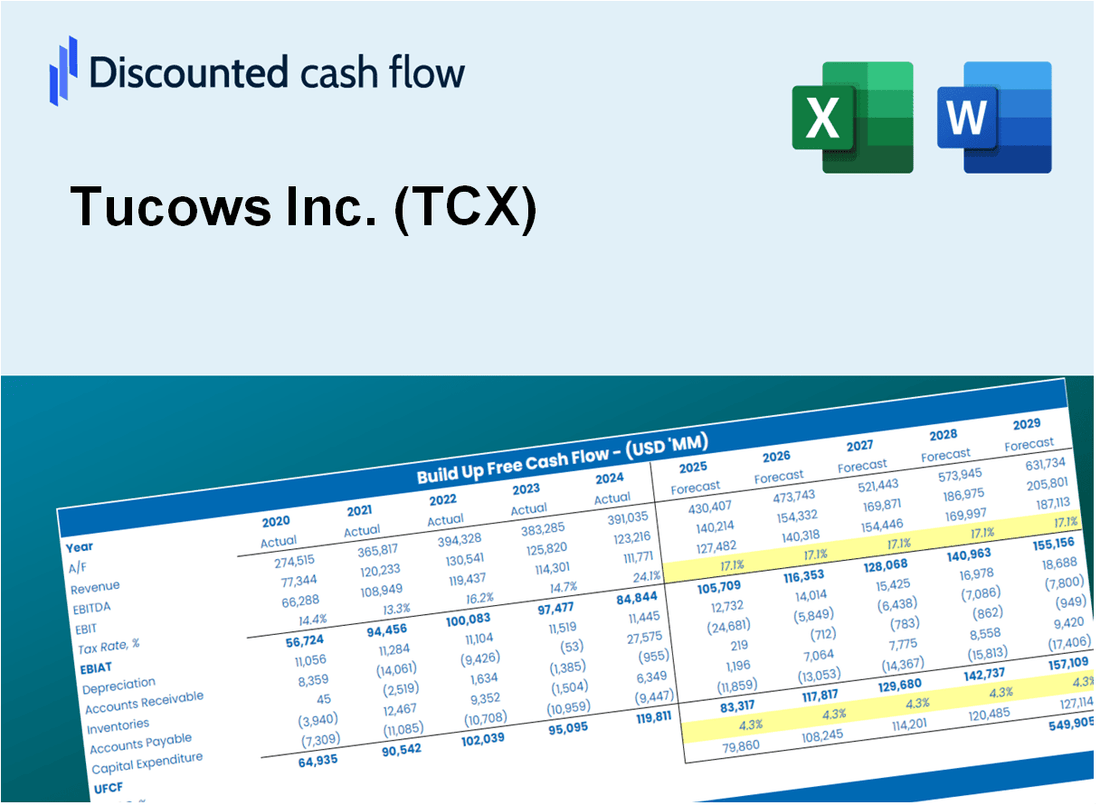
Améliorez vos stratégies d'investissement avec la calculatrice DCF Tucows Inc. (TCX)! Plongez dans des données financières authentiques de TucoCows, ajustez les projections et dépenses de croissance et observez immédiatement comment ces altérations influencent la valeur intrinsèque de Tucows Inc. (TCX).
Discounted Cash Flow (DCF) - (USD MM)
| Year | AY1 2020 |
AY2 2021 |
AY3 2022 |
AY4 2023 |
AY5 2024 |
FY1 2025 |
FY2 2026 |
FY3 2027 |
FY4 2028 |
FY5 2029 |
|---|---|---|---|---|---|---|---|---|---|---|
| Revenue | 311.2 | 304.3 | 321.1 | 339.3 | 362.3 | 376.5 | 391.3 | 406.8 | 422.8 | 439.4 |
| Revenue Growth, % | 0 | -2.21 | 5.52 | 5.67 | 6.76 | 3.94 | 3.94 | 3.94 | 3.94 | 3.94 |
| EBITDA | 33.6 | 211.3 | 26.2 | -12.2 | -1.8 | 63.5 | 66.0 | 68.6 | 71.3 | 74.1 |
| EBITDA, % | 10.81 | 69.44 | 8.17 | -3.59 | -0.50266 | 16.87 | 16.87 | 16.87 | 16.87 | 16.87 |
| Depreciation | 24.1 | 199.5 | 211.1 | 46.6 | 45.6 | 124.5 | 129.4 | 134.5 | 139.8 | 145.3 |
| Depreciation, % | 7.73 | 65.54 | 65.73 | 13.74 | 12.59 | 33.07 | 33.07 | 33.07 | 33.07 | 33.07 |
| EBIT | 9.6 | 11.9 | -184.8 | -58.8 | -47.4 | -61.0 | -63.4 | -65.9 | -68.5 | -71.2 |
| EBIT, % | 3.08 | 3.91 | -57.55 | -17.34 | -13.1 | -16.2 | -16.2 | -16.2 | -16.2 | -16.2 |
| Total Cash | 8.3 | 9.1 | 23.5 | 92.7 | 56.9 | 42.2 | 43.8 | 45.6 | 47.3 | 49.2 |
| Total Cash, percent | .0 | .0 | .0 | .0 | .0 | .0 | .0 | .0 | .0 | .0 |
| Account Receivables | 16.8 | 18.8 | 26.0 | 23.6 | 21.1 | 24.5 | 25.4 | 26.4 | 27.5 | 28.6 |
| Account Receivables, % | 5.41 | 6.19 | 8.11 | 6.96 | 5.82 | 6.5 | 6.5 | 6.5 | 6.5 | 6.5 |
| Inventories | 1.9 | 3.3 | 7.3 | 6.8 | 4.0 | 5.3 | 5.5 | 5.7 | 6.0 | 6.2 |
| Inventories, % | 0.6025 | 1.08 | 2.27 | 2 | 1.1 | 1.41 | 1.41 | 1.41 | 1.41 | 1.41 |
| Accounts Payable | 6.3 | 10.0 | 17.2 | 12.7 | 9.0 | 12.7 | 13.2 | 13.7 | 14.3 | 14.8 |
| Accounts Payable, % | 2.03 | 3.29 | 5.35 | 3.74 | 2.49 | 3.38 | 3.38 | 3.38 | 3.38 | 3.38 |
| Capital Expenditure | -44.5 | -73.9 | -137.5 | -92.6 | -56.5 | -93.6 | -97.3 | -101.1 | -105.1 | -109.2 |
| Capital Expenditure, % | -14.3 | -24.3 | -42.81 | -27.28 | -15.58 | -24.86 | -24.86 | -24.86 | -24.86 | -24.86 |
| Tax Rate, % | -7.84 | -7.84 | -7.84 | -7.84 | -7.84 | -7.84 | -7.84 | -7.84 | -7.84 | -7.84 |
| EBITAT | 5.1 | 5.5 | -183.4 | -54.9 | -51.2 | -47.9 | -49.8 | -51.7 | -53.8 | -55.9 |
| Depreciation | ||||||||||
| Changes in Account Receivables | ||||||||||
| Changes in Inventories | ||||||||||
| Changes in Accounts Payable | ||||||||||
| Capital Expenditure | ||||||||||
| UFCF | -27.7 | 131.3 | -113.9 | -102.4 | -60.3 | -18.0 | -18.3 | -19.0 | -19.8 | -20.6 |
| WACC, % | 5.34 | 4.86 | 8.32 | 7.93 | 8.37 | 6.96 | 6.96 | 6.96 | 6.96 | 6.96 |
| PV UFCF | ||||||||||
| SUM PV UFCF | -78.1 | |||||||||
| Long Term Growth Rate, % | 2.00 | |||||||||
| Free cash flow (T + 1) | -21 | |||||||||
| Terminal Value | -422 | |||||||||
| Present Terminal Value | -302 | |||||||||
| Enterprise Value | -380 | |||||||||
| Net Debt | 456 | |||||||||
| Equity Value | -836 | |||||||||
| Diluted Shares Outstanding, MM | 11 | |||||||||
| Equity Value Per Share | -76.23 |
What You Will Get
- Real TCX Financial Data: Pre-filled with Tucows Inc.'s historical and projected data for precise analysis.
- Fully Editable Template: Modify key inputs like revenue growth, WACC, and EBITDA % with ease.
- Automatic Calculations: See Tucows Inc.'s intrinsic value update instantly based on your changes.
- Professional Valuation Tool: Designed for investors, analysts, and consultants seeking accurate DCF results.
- User-Friendly Design: Simple structure and clear instructions for all experience levels.
Key Features
- Customizable Revenue Inputs: Adjust essential factors such as subscriber growth, ARPU, and operational expenses.
- Instant DCF Valuation: Quickly computes intrinsic value, NPV, and various financial metrics.
- High-Precision Accuracy: Leverages Tucows Inc.'s (TCX) actual financial data for credible valuation results.
- Simplified Scenario Analysis: Effortlessly explore different scenarios and evaluate results side by side.
- Efficiency Booster: Remove the hassle of creating intricate valuation models from the ground up.
How It Works
- 1. Access the Template: Download and open the Excel file featuring Tucows Inc. (TCX)'s preloaded data.
- 2. Modify Assumptions: Adjust key inputs such as growth rates, WACC, and capital expenditures.
- 3. View Results Instantly: The DCF model automatically calculates intrinsic value and NPV.
- 4. Explore Scenarios: Analyze various forecasts to evaluate different valuation outcomes.
- 5. Present with Confidence: Share professional valuation insights to back your decisions.
Why Choose This Calculator for Tucows Inc. (TCX)?
- All-in-One Solution: Features DCF, WACC, and financial ratio analyses tailored specifically for Tucows Inc.
- Flexible Inputs: Modify the highlighted cells to explore different scenarios for Tucows Inc. (TCX).
- In-Depth Analysis: Automatically computes Tucows Inc.'s intrinsic value and Net Present Value.
- Preloaded Information: Access to historical and projected data for accurate assessments.
- Expert-Level Tool: Perfect for financial analysts, investors, and consultants focusing on Tucows Inc. (TCX).
Who Should Use This Product?
- Investors: Evaluate Tucows Inc. (TCX) to make informed buying or selling decisions.
- CFOs and Financial Analysts: Enhance valuation methodologies and assess financial forecasts.
- Startup Founders: Understand the valuation strategies of established companies like Tucows Inc.
- Consultants: Provide comprehensive valuation analyses and reports for clients.
- Students and Educators: Utilize real-time data to learn and teach valuation practices.
What the Template Contains
- Pre-Filled DCF Model: Tucows Inc.’s (TCX) financial data preloaded for immediate use.
- WACC Calculator: Detailed calculations for Weighted Average Cost of Capital.
- Financial Ratios: Evaluate Tucows Inc.’s (TCX) profitability, leverage, and efficiency.
- Editable Inputs: Change assumptions such as growth, margins, and CAPEX to fit your scenarios.
- Financial Statements: Annual and quarterly reports to support detailed analysis.
- Interactive Dashboard: Easily visualize key valuation metrics and results.
Disclaimer
All information, articles, and product details provided on this website are for general informational and educational purposes only. We do not claim any ownership over, nor do we intend to infringe upon, any trademarks, copyrights, logos, brand names, or other intellectual property mentioned or depicted on this site. Such intellectual property remains the property of its respective owners, and any references here are made solely for identification or informational purposes, without implying any affiliation, endorsement, or partnership.
We make no representations or warranties, express or implied, regarding the accuracy, completeness, or suitability of any content or products presented. Nothing on this website should be construed as legal, tax, investment, financial, medical, or other professional advice. In addition, no part of this site—including articles or product references—constitutes a solicitation, recommendation, endorsement, advertisement, or offer to buy or sell any securities, franchises, or other financial instruments, particularly in jurisdictions where such activity would be unlawful.
All content is of a general nature and may not address the specific circumstances of any individual or entity. It is not a substitute for professional advice or services. Any actions you take based on the information provided here are strictly at your own risk. You accept full responsibility for any decisions or outcomes arising from your use of this website and agree to release us from any liability in connection with your use of, or reliance upon, the content or products found herein.