
|
TD Power Systems Limited (TDPowersys.NS) Évaluation DCF |
Entièrement Modifiable: Adapté À Vos Besoins Dans Excel Ou Sheets
Conception Professionnelle: Modèles Fiables Et Conformes Aux Normes Du Secteur
Pré-Construits Pour Une Utilisation Rapide Et Efficace
Compatible MAC/PC, entièrement débloqué
Aucune Expertise N'Est Requise; Facile À Suivre
TD Power Systems Limited (TDPOWERSYS.NS) Bundle
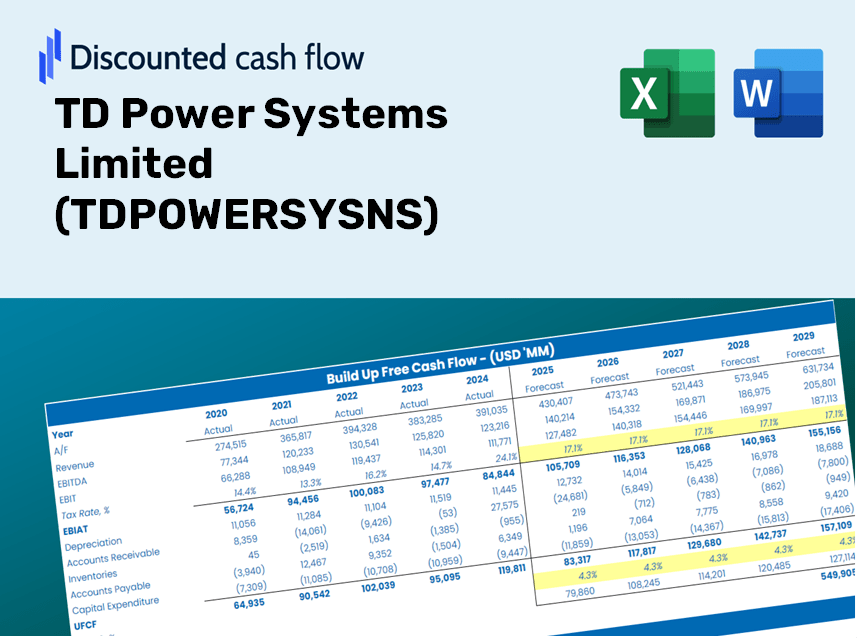
Explorez l'avenir financier de TD Power Systems Limited (TDPOWERSYSNS) avec notre calculatrice DCF conviviale! Entrez vos hypothèses concernant la croissance, les marges et les coûts pour calculer la valeur intrinsèque de TD Power Systems Limited (TDPowersysns) et améliorez votre stratégie d'investissement.
What You Will Receive
- Pre-Filled Financial Model: TD Power Systems Limited’s actual data allows for accurate DCF valuation.
- Comprehensive Forecast Control: Modify revenue growth, profit margins, WACC, and other critical drivers.
- Real-Time Calculations: Instantaneous updates provide immediate feedback as you make adjustments.
- Professional-Grade Template: A polished Excel file crafted for high-quality valuation presentations.
- Flexible and Reusable: Designed for adaptability, enabling repeated use for in-depth forecasts.
Key Features
- Pre-Loaded Data: TD Power Systems Limited’s historical financial statements and pre-filled forecasts.
- Fully Adjustable Inputs: Modify WACC, tax rates, revenue growth, and EBITDA margins to suit your analysis.
- Instant Results: View TD Power Systems Limited’s intrinsic value recalculating in real time.
- Clear Visual Outputs: Dashboard charts provide a visual representation of valuation results and essential metrics.
- Built for Accuracy: A professional-grade tool designed for analysts, investors, and finance professionals.
How It Functions
- Step 1: Download the ready-to-use Excel template featuring TD Power Systems Limited's data.
- Step 2: Navigate through the pre-populated sheets to familiarize yourself with the essential metrics.
- Step 3: Modify the forecasts and assumptions in the editable yellow cells (WACC, growth, margins).
- Step 4: Quickly see the updated calculations, including the intrinsic value of TD Power Systems Limited (TDPOWERSYSNS).
- Step 5: Use the outputs to make well-informed investment choices or create detailed reports.
Why Choose This Calculator for TD Power Systems Limited (TDPOWERSYSNS)?
- All-in-One Solution: Features DCF, WACC, and financial ratio analyses seamlessly integrated.
- Customizable Variables: Modify the yellow-highlighted cells to explore different scenarios.
- In-Depth Analysis: Automatically calculates the intrinsic value and Net Present Value for TD Power Systems Limited.
- Built-In Data: Historical and projected data provide reliable foundations for analysis.
- Designed for Professionals: Perfect for financial analysts, investors, and business consultants focused on TD Power Systems Limited.
Who Can Benefit from This Product?
- Investors: Accurately assess the fair value of TD Power Systems Limited (TDPOWERSYSNS) before making investment choices.
- CFOs: Utilize a professional-grade DCF model for precise financial reporting and analysis.
- Consultants: Easily customize the template for valuation reports catered to clients.
- Entrepreneurs: Discover financial modeling insights applied by leading companies in the power systems sector.
- Educators: Employ it as a teaching resource to illustrate valuation techniques.
Contents of the Template
- In-Depth DCF Model: Customizable template featuring thorough valuation calculations.
- Real-World Data: TD Power Systems Limited’s historical and projected financial data preloaded for comprehensive analysis.
- Adjustable Parameters: Modify WACC, growth rates, and tax assumptions to explore various scenarios.
- Complete Financial Statements: Detailed annual and quarterly breakdowns for enhanced insights.
- Essential Ratios: Integrated analysis for metrics such as profitability, efficiency, and leverage.
- Interactive Dashboard with Visual Outputs: Graphs and tables presenting clear, actionable insights.
Disclaimer
All information, articles, and product details provided on this website are for general informational and educational purposes only. We do not claim any ownership over, nor do we intend to infringe upon, any trademarks, copyrights, logos, brand names, or other intellectual property mentioned or depicted on this site. Such intellectual property remains the property of its respective owners, and any references here are made solely for identification or informational purposes, without implying any affiliation, endorsement, or partnership.
We make no representations or warranties, express or implied, regarding the accuracy, completeness, or suitability of any content or products presented. Nothing on this website should be construed as legal, tax, investment, financial, medical, or other professional advice. In addition, no part of this site—including articles or product references—constitutes a solicitation, recommendation, endorsement, advertisement, or offer to buy or sell any securities, franchises, or other financial instruments, particularly in jurisdictions where such activity would be unlawful.
All content is of a general nature and may not address the specific circumstances of any individual or entity. It is not a substitute for professional advice or services. Any actions you take based on the information provided here are strictly at your own risk. You accept full responsibility for any decisions or outcomes arising from your use of this website and agree to release us from any liability in connection with your use of, or reliance upon, the content or products found herein.