
|
Atlassian Corporation plc (équipe) Valation DCF |
Entièrement Modifiable: Adapté À Vos Besoins Dans Excel Ou Sheets
Conception Professionnelle: Modèles Fiables Et Conformes Aux Normes Du Secteur
Pré-Construits Pour Une Utilisation Rapide Et Efficace
Compatible MAC/PC, entièrement débloqué
Aucune Expertise N'Est Requise; Facile À Suivre
Atlassian Corporation Plc (TEAM) Bundle
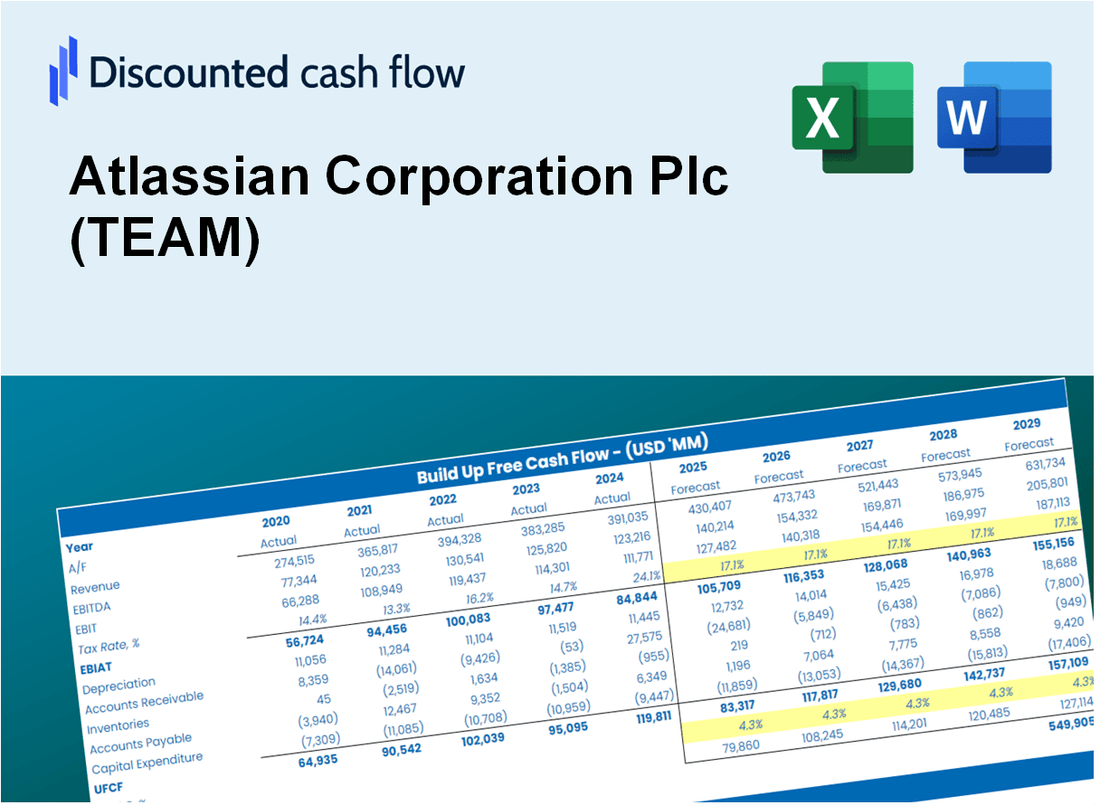
Gagnez de la maîtrise sur votre analyse de l'évaluation de votre Atlassian Corporation Plc (Team) avec notre calculatrice DCF à la pointe de la technologie! Ce modèle Excel est préchargé avec des données précises (d'équipe), vous permettant d'ajuster les prévisions et les hypothèses pour déterminer la valeur intrinsèque d'Atlassian avec précision.
What You Will Receive
- Authentic TEAM Financial Data: Pre-populated with Atlassian’s historical and forecasted data for accurate analysis.
- Completely Customizable Template: Easily adjust key metrics such as revenue growth, WACC, and EBITDA %.
- Instant Calculations: Watch Atlassian’s intrinsic value update in real-time as you make adjustments.
- Expert Valuation Tool: Tailored for investors, analysts, and consultants aiming for precise DCF outcomes.
- Intuitive Design: Clear layout and straightforward instructions suitable for all skill levels.
Key Features
- Pre-Loaded Data: Atlassian’s historical financial statements and pre-filled forecasts.
- Fully Adjustable Inputs: Modify WACC, tax rates, revenue growth, and EBITDA margins as needed.
- Instant Results: Observe Atlassian’s intrinsic value recalculating in real time.
- Clear Visual Outputs: Dashboard charts illustrate valuation results and key metrics effectively.
- Built for Accuracy: A professional tool designed for analysts, investors, and finance experts.
How It Works
- Download: Obtain the pre-formatted Excel file featuring Atlassian's financial data.
- Customize: Modify projections, such as revenue growth, EBITDA margin, and WACC.
- Update Automatically: The intrinsic value and NPV calculations refresh in real-time.
- Test Scenarios: Develop various forecasts and assess results instantly.
- Make Decisions: Leverage the valuation findings to inform your investment approach.
Why Choose This Calculator for Atlassian Corporation Plc (TEAM)?
- Accuracy: Utilizes authentic Atlassian financials for precise data.
- Flexibility: Built for users to easily test and adjust inputs as needed.
- Time-Saving: Eliminate the need to create a DCF model from the ground up.
- Professional-Grade: Crafted with the expertise and usability expected by CFOs.
- User-Friendly: Intuitive design suitable for users without extensive financial modeling skills.
Who Should Use This Product?
- Investors: Accurately assess Atlassian’s fair value before making investment choices.
- CFOs: Utilize a professional-grade DCF model for financial analysis and reporting.
- Consultants: Easily customize the template for client valuation reports.
- Entrepreneurs: Acquire insights into financial modeling practices of leading tech firms.
- Educators: Employ it as a teaching resource to illustrate valuation techniques.
What the Template Contains
- Pre-Filled Data: Includes Atlassian’s historical financials and forecasts.
- Discounted Cash Flow Model: Editable DCF valuation model with automatic calculations.
- Weighted Average Cost of Capital (WACC): A dedicated sheet for calculating WACC based on custom inputs.
- Key Financial Ratios: Analyze Atlassian’s profitability, efficiency, and leverage.
- Customizable Inputs: Edit revenue growth, margins, and tax rates with ease.
- Clear Dashboard: Charts and tables summarizing key valuation results.
Disclaimer
All information, articles, and product details provided on this website are for general informational and educational purposes only. We do not claim any ownership over, nor do we intend to infringe upon, any trademarks, copyrights, logos, brand names, or other intellectual property mentioned or depicted on this site. Such intellectual property remains the property of its respective owners, and any references here are made solely for identification or informational purposes, without implying any affiliation, endorsement, or partnership.
We make no representations or warranties, express or implied, regarding the accuracy, completeness, or suitability of any content or products presented. Nothing on this website should be construed as legal, tax, investment, financial, medical, or other professional advice. In addition, no part of this site—including articles or product references—constitutes a solicitation, recommendation, endorsement, advertisement, or offer to buy or sell any securities, franchises, or other financial instruments, particularly in jurisdictions where such activity would be unlawful.
All content is of a general nature and may not address the specific circumstances of any individual or entity. It is not a substitute for professional advice or services. Any actions you take based on the information provided here are strictly at your own risk. You accept full responsibility for any decisions or outcomes arising from your use of this website and agree to release us from any liability in connection with your use of, or reliance upon, the content or products found herein.