
|
Tessenderlo Group NV (TESB.BR) Évaluation DCF |
Entièrement Modifiable: Adapté À Vos Besoins Dans Excel Ou Sheets
Conception Professionnelle: Modèles Fiables Et Conformes Aux Normes Du Secteur
Pré-Construits Pour Une Utilisation Rapide Et Efficace
Compatible MAC/PC, entièrement débloqué
Aucune Expertise N'Est Requise; Facile À Suivre
Tessenderlo Group NV (TESB.BR) Bundle
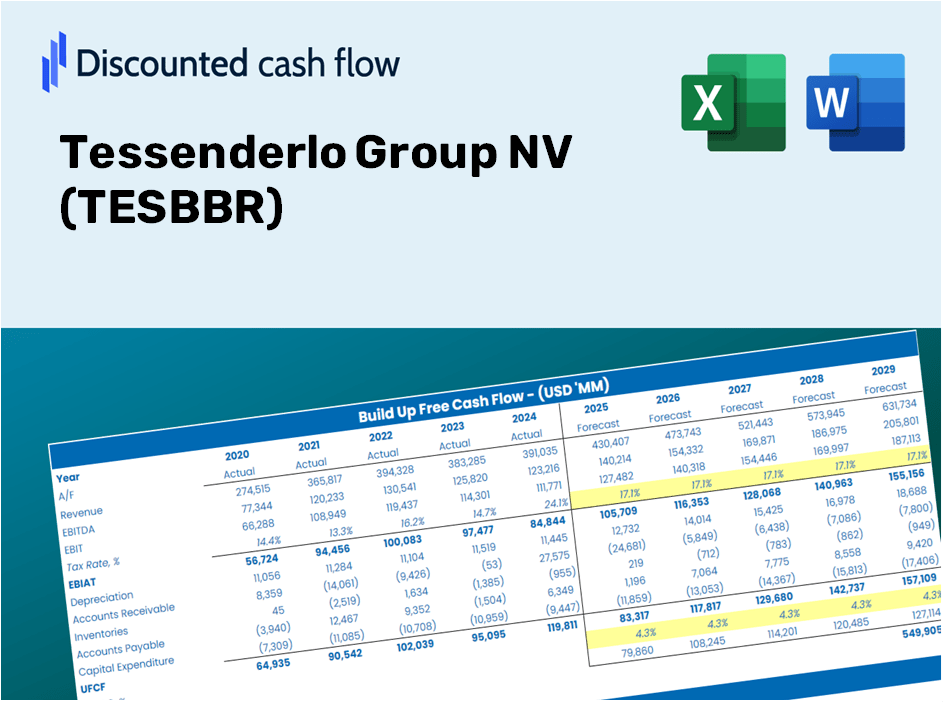
Gardez un aperçu de votre analyse d'évaluation de votre groupe Tessender Group NV (TESBBR) à l'aide de notre calculatrice sophistiquée DCF! Ce modèle Excel est préchargé avec de vraies données TESBBR, vous permettant d'ajuster les prévisions et les hypothèses pour déterminer la valeur intrinsèque du groupe Tessender NV avec précision.
Discounted Cash Flow (DCF) - (USD MM)
| Year | AY1 2020 |
AY2 2021 |
AY3 2022 |
AY4 2023 |
AY5 2024 |
FY1 2025 |
FY2 2026 |
FY3 2027 |
FY4 2028 |
FY5 2029 |
|---|---|---|---|---|---|---|---|---|---|---|
| Revenue | 1,737.3 | 2,081.5 | 2,587.5 | 2,928.3 | 2,647.7 | 2,492.0 | 2,345.4 | 2,207.5 | 2,077.7 | 1,955.5 |
| Revenue Growth, % | 0 | 19.81 | 24.31 | 13.17 | -9.58 | -5.88 | -5.88 | -5.88 | -5.88 | -5.88 |
| EBITDA | 313.3 | 355.7 | 428.1 | 327.5 | 264.0 | 362.9 | 341.6 | 321.5 | 302.6 | 284.8 |
| EBITDA, % | 18.03 | 17.09 | 16.54 | 11.18 | 9.97 | 14.56 | 14.56 | 14.56 | 14.56 | 14.56 |
| Depreciation | 131.0 | 130.6 | 134.7 | 201.5 | 204.5 | 167.6 | 157.7 | 148.5 | 139.7 | 131.5 |
| Depreciation, % | 7.54 | 6.27 | 5.21 | 6.88 | 7.72 | 6.73 | 6.73 | 6.73 | 6.73 | 6.73 |
| EBIT | 182.3 | 225.1 | 293.4 | 126.0 | 59.5 | 195.4 | 183.9 | 173.1 | 162.9 | 153.3 |
| EBIT, % | 10.49 | 10.81 | 11.34 | 4.3 | 2.25 | 7.84 | 7.84 | 7.84 | 7.84 | 7.84 |
| Total Cash | 250.1 | 330.3 | 156.1 | 177.0 | 252.4 | 258.5 | 243.3 | 229.0 | 215.6 | 202.9 |
| Total Cash, percent | .0 | .0 | .0 | .0 | .0 | .0 | .0 | .0 | .0 | .0 |
| Account Receivables | 277.4 | 376.9 | 428.2 | 455.4 | 438.2 | 412.3 | 388.1 | 365.2 | 343.8 | 323.5 |
| Account Receivables, % | 15.97 | 18.11 | 16.55 | 15.55 | 16.55 | 16.55 | 16.55 | 16.55 | 16.55 | 16.55 |
| Inventories | 332.1 | 393.4 | 566.9 | 604.5 | 560.3 | 507.0 | 477.2 | 449.1 | 422.7 | 397.9 |
| Inventories, % | 19.12 | 18.9 | 21.91 | 20.64 | 21.16 | 20.35 | 20.35 | 20.35 | 20.35 | 20.35 |
| Accounts Payable | 172.7 | 245.5 | 272.8 | 260.3 | 274.8 | 256.9 | 241.8 | 227.6 | 214.2 | 201.6 |
| Accounts Payable, % | 9.94 | 11.79 | 10.54 | 8.89 | 10.38 | 10.31 | 10.31 | 10.31 | 10.31 | 10.31 |
| Capital Expenditure | -99.5 | -95.7 | -112.8 | -178.5 | -179.7 | -137.4 | -129.3 | -121.7 | -114.6 | -107.8 |
| Capital Expenditure, % | -5.73 | -4.6 | -4.36 | -6.1 | -6.79 | -5.51 | -5.51 | -5.51 | -5.51 | -5.51 |
| Tax Rate, % | 10.48 | 10.48 | 10.48 | 10.48 | 10.48 | 10.48 | 10.48 | 10.48 | 10.48 | 10.48 |
| EBITAT | 135.3 | 183.1 | 230.2 | 118.5 | 53.3 | 163.2 | 153.6 | 144.5 | 136.0 | 128.0 |
| Depreciation | ||||||||||
| Changes in Account Receivables | ||||||||||
| Changes in Inventories | ||||||||||
| Changes in Accounts Payable | ||||||||||
| Capital Expenditure | ||||||||||
| UFCF | -270.0 | 130.0 | 54.6 | 64.2 | 154.0 | 254.6 | 220.9 | 208.0 | 195.7 | 184.2 |
| WACC, % | 5.18 | 5.22 | 5.21 | 5.31 | 5.28 | 5.24 | 5.24 | 5.24 | 5.24 | 5.24 |
| PV UFCF | ||||||||||
| SUM PV UFCF | 922.2 | |||||||||
| Long Term Growth Rate, % | 2.00 | |||||||||
| Free cash flow (T + 1) | 188 | |||||||||
| Terminal Value | 5,803 | |||||||||
| Present Terminal Value | 4,496 | |||||||||
| Enterprise Value | 5,418 | |||||||||
| Net Debt | 75 | |||||||||
| Equity Value | 5,343 | |||||||||
| Diluted Shares Outstanding, MM | 61 | |||||||||
| Equity Value Per Share | 86.92 |
What You Will Receive
- Authentic TESBBR Financial Data: Pre-filled with Tessenderlo Group NV’s historical and anticipated data for detailed analysis.
- Customizable Template: Effortlessly adjust key parameters such as revenue growth, WACC, and EBITDA percentage.
- Instant Calculations: Observe updates to Tessenderlo Group NV’s intrinsic value in real-time as you make modifications.
- Professional Valuation Instrument: Tailored for investors, analysts, and consultants in need of precise DCF outcomes.
- Intuitive Layout: Streamlined structure and straightforward instructions suitable for all skill levels.
Key Features
- Advanced DCF Calculator: Features comprehensive unlevered and levered DCF valuation models tailored for Tessenderlo Group NV (TESBBR).
- WACC Calculator: Comes with a pre-built Weighted Average Cost of Capital sheet that allows for customizable inputs specific to the company.
- Editable Forecast Assumptions: Adjust growth rates, capital expenditures, and discount rates as needed for personalized financial projections.
- Built-In Financial Ratios: Evaluate profitability, leverage, and efficiency ratios to gain insights into Tessenderlo Group NV (TESBBR).
- Dashboard and Charts: Visual representations that concisely summarize key valuation metrics for straightforward analysis.
How It Works
- Step 1: Download the prebuilt Excel template featuring Tessenderlo Group NV's (TESBBR) data.
- Step 2: Review the pre-filled sheets to familiarize yourself with the key metrics.
- Step 3: Modify forecasts and assumptions in the editable yellow cells (WACC, growth, margins).
- Step 4: Instantly see the updated results, including Tessenderlo Group NV's (TESBBR) intrinsic value.
- Step 5: Use the outputs to make informed investment decisions or create reports.
Why Choose the Tessenderlo Calculator?
- All-in-One Solution: Features DCF, WACC, and financial ratio analyses, all conveniently packaged.
- Flexible Inputs: Modify the yellow-highlighted cells to explore different scenarios.
- In-Depth Analysis: Automatically computes Tessenderlo Group's intrinsic value and Net Present Value.
- Data Ready for Use: Comes with historical and projected data for accurate analysis.
- High-Quality Standards: Perfect for financial analysts, investors, and business advisors.
Who Is This Product Suitable For?
- Investors: Gain the confidence to make informed choices with a top-tier valuation tool.
- Financial Analysts: Streamline your workflow with a ready-to-use DCF model that you can easily modify.
- Consultants: Effortlessly tailor the template for client presentations or comprehensive reports.
- Finance Enthusiasts: Enhance your knowledge of valuation methods through practical, real-life examples.
- Educators and Students: Utilize it as an effective learning resource in finance courses.
What the Template Includes
- Preloaded TESBBR Data: Comprehensive historical and projected financial information, encompassing revenue, EBIT, and capital expenditures.
- DCF and WACC Models: Advanced spreadsheets designed for calculating intrinsic value and Weighted Average Cost of Capital.
- Editable Inputs: Cells highlighted in yellow for easy adjustments to revenue growth, tax rates, and discount rates.
- Financial Statements: Detailed annual and quarterly financial reports for in-depth analysis.
- Key Ratios: Metrics for assessing profitability, leverage, and efficiency to evaluate performance.
- Dashboard and Charts: Visual representations of valuation results and underlying assumptions.
Disclaimer
All information, articles, and product details provided on this website are for general informational and educational purposes only. We do not claim any ownership over, nor do we intend to infringe upon, any trademarks, copyrights, logos, brand names, or other intellectual property mentioned or depicted on this site. Such intellectual property remains the property of its respective owners, and any references here are made solely for identification or informational purposes, without implying any affiliation, endorsement, or partnership.
We make no representations or warranties, express or implied, regarding the accuracy, completeness, or suitability of any content or products presented. Nothing on this website should be construed as legal, tax, investment, financial, medical, or other professional advice. In addition, no part of this site—including articles or product references—constitutes a solicitation, recommendation, endorsement, advertisement, or offer to buy or sell any securities, franchises, or other financial instruments, particularly in jurisdictions where such activity would be unlawful.
All content is of a general nature and may not address the specific circumstances of any individual or entity. It is not a substitute for professional advice or services. Any actions you take based on the information provided here are strictly at your own risk. You accept full responsibility for any decisions or outcomes arising from your use of this website and agree to release us from any liability in connection with your use of, or reliance upon, the content or products found herein.