
|
Télévision française 1 société anonyme (tfi.pa) Valation dcf |
Entièrement Modifiable: Adapté À Vos Besoins Dans Excel Ou Sheets
Conception Professionnelle: Modèles Fiables Et Conformes Aux Normes Du Secteur
Pré-Construits Pour Une Utilisation Rapide Et Efficace
Compatible MAC/PC, entièrement débloqué
Aucune Expertise N'Est Requise; Facile À Suivre
Télévision Française 1 SA (TFI.PA) Bundle
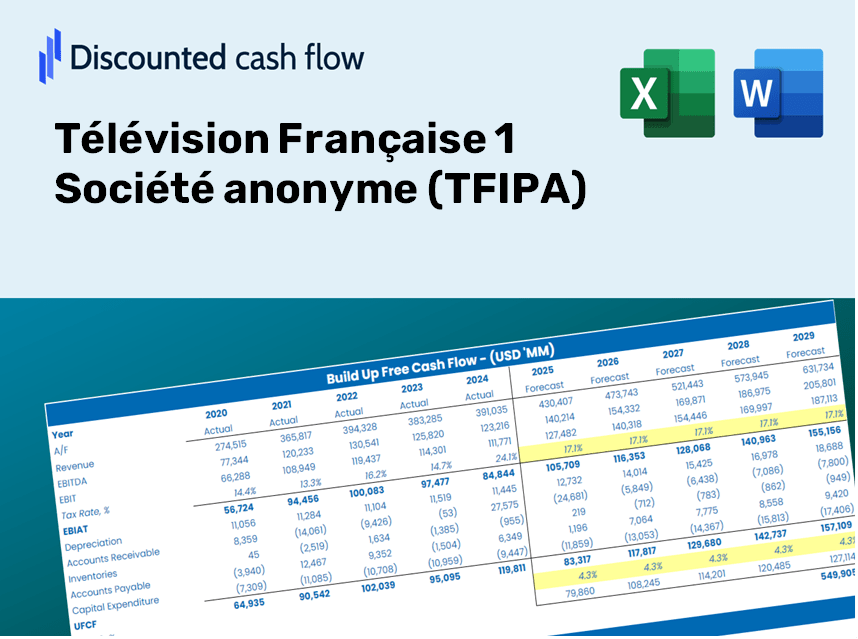
Conçu pour la précision, notre calculatrice DCF (TFIPA) vous permet d'évaluer l'évaluation de Télévision Française 1 société anonyme à l'aide de données financières réelles, offrant une flexibilité complète pour modifier tous les paramètres clés pour des prévisions améliorées.
What You Will Receive
- Genuine TFIPA Data: Preloaded financials – covering everything from revenue to EBIT – utilizing both actual and projected figures.
- Comprehensive Customization: Modify all essential parameters (yellow cells) such as WACC, growth rate, and tax percentages.
- Real-Time Valuation Updates: Automatic recalculations to assess how changes affect TFIPA's fair value.
- Flexible Excel Template: Designed for rapid edits, scenario analysis, and in-depth projections.
- Efficient and Precise: Eliminate the need to build models from the ground up while ensuring accuracy and adaptability.
Key Features
- Pre-Loaded Data: TF1's historical financial statements and pre-filled forecasts.
- Fully Adjustable Inputs: Modify WACC, tax rates, revenue growth, and EBITDA margins.
- Instant Results: Observe TF1's intrinsic value recalculating in real time.
- Clear Visual Outputs: Dashboard charts showcase valuation results and essential metrics.
- Built for Accuracy: A professional tool tailored for analysts, investors, and finance professionals.
How It Works
- Step 1: Download the Excel file for Télévision Française 1 Société anonyme (TFIPA) [Symbol].
- Step 2: Review TFIPA's pre-filled financial data and forecasts.
- Step 3: Adjust key inputs such as revenue growth, WACC, and tax rates (highlighted cells).
- Step 4: Observe the DCF model update in real-time as you modify your assumptions.
- Step 5: Evaluate the results and leverage the outputs for your investment decisions.
Why Choose This Calculator for TFIPA?
- User-Friendly Interface: Perfect for both newcomers and seasoned professionals.
- Customizable Inputs: Adjust parameters effortlessly to suit your analysis needs.
- Real-Time Valuation: Observe immediate updates to TFIPA's valuation as you tweak the inputs.
- Pre-Configured Data: Comes with TFIPA's actual financial information for swift evaluations.
- Favored by Experts: Widely utilized by investors and analysts for making well-informed decisions.
Who Can Benefit from TFIPA's Services?
- Investors: Make informed choices with our high-quality valuation tools tailored for your needs.
- Financial Analysts: Save valuable time with our customizable DCF model that comes pre-built.
- Consultants: Effortlessly modify our templates for client presentations or detailed reports.
- Finance Enthusiasts: Enhance your knowledge of valuation methods through practical, real-world examples.
- Educators and Students: Utilize our resources as an effective learning aid in finance courses.
Contents of the Template
- Operating and Balance Sheet Data: Pre-filled historical data and forecasts for Télévision Française 1 Société anonyme (TFIPA), including revenue, EBITDA, EBIT, and capital expenditures.
- WACC Calculation: A dedicated sheet for the Weighted Average Cost of Capital (WACC), encompassing parameters such as Beta, risk-free rate, and share price.
- DCF Valuation (Unlevered and Levered): Customizable Discounted Cash Flow models that provide intrinsic value along with comprehensive calculations.
- Financial Statements: Preloaded financial statements (annual and quarterly) to assist in analysis.
- Key Ratios: Contains profitability, leverage, and efficiency ratios relevant to Télévision Française 1 Société anonyme (TFIPA).
- Dashboard and Charts: A visual overview of valuation outputs and assumptions to facilitate result analysis.
Disclaimer
All information, articles, and product details provided on this website are for general informational and educational purposes only. We do not claim any ownership over, nor do we intend to infringe upon, any trademarks, copyrights, logos, brand names, or other intellectual property mentioned or depicted on this site. Such intellectual property remains the property of its respective owners, and any references here are made solely for identification or informational purposes, without implying any affiliation, endorsement, or partnership.
We make no representations or warranties, express or implied, regarding the accuracy, completeness, or suitability of any content or products presented. Nothing on this website should be construed as legal, tax, investment, financial, medical, or other professional advice. In addition, no part of this site—including articles or product references—constitutes a solicitation, recommendation, endorsement, advertisement, or offer to buy or sell any securities, franchises, or other financial instruments, particularly in jurisdictions where such activity would be unlawful.
All content is of a general nature and may not address the specific circumstances of any individual or entity. It is not a substitute for professional advice or services. Any actions you take based on the information provided here are strictly at your own risk. You accept full responsibility for any decisions or outcomes arising from your use of this website and agree to release us from any liability in connection with your use of, or reliance upon, the content or products found herein.