
|
Évaluation DCF Thermax Limited (Thermax.NS) |
Entièrement Modifiable: Adapté À Vos Besoins Dans Excel Ou Sheets
Conception Professionnelle: Modèles Fiables Et Conformes Aux Normes Du Secteur
Pré-Construits Pour Une Utilisation Rapide Et Efficace
Compatible MAC/PC, entièrement débloqué
Aucune Expertise N'Est Requise; Facile À Suivre
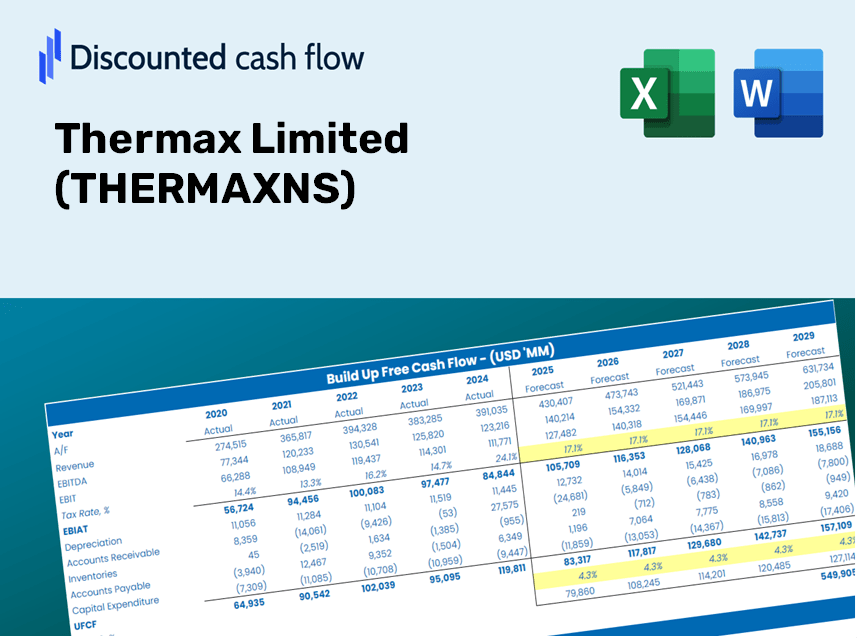
Thermax Limited (THERMAX.NS) Bundle
En tant qu'investisseur ou analyste, cette calculatrice DCF (Thermaxns) sert de ressource incontournable pour une évaluation précise. Équipé de données réelles de Thermax Limited, vous pouvez ajuster les prévisions et observer immédiatement les effets.
Benefits of Choosing Thermax Limited (THERMAXNS)
- Comprehensive Financial Model: Access precise DCF valuation powered by Thermax Limited’s actual performance data.
- Complete Forecast Flexibility: Modify key metrics such as revenue growth, profit margins, and WACC to suit your analysis.
- Real-Time Calculations: Immediate updates allow you to see the impact of your adjustments instantly.
- Professional-Quality Template: An expertly crafted Excel file ready for investor presentations and evaluations.
- Adaptable and Reusable: Designed for versatility, facilitating ongoing use for in-depth financial forecasting.
Key Features
- Comprehensive DCF Calculator: Features detailed unlevered and levered DCF valuation models tailored for Thermax Limited (THERMAXNS).
- WACC Calculator: Offers a pre-structured Weighted Average Cost of Capital sheet with adjustable parameters.
- Editability of Forecast Assumptions: Customize growth rates, capital investments, and discount rates to fit your analysis.
- Integrated Financial Ratios: Evaluate profitability, leverage, and operational efficiency ratios specific to Thermax Limited (THERMAXNS).
- Visual Dashboard and Charts: Provides graphical representations that summarize essential valuation metrics for straightforward interpretation.
How It Works
- Step 1: Download the Excel file.
- Step 2: Review Thermax Limited’s (THERMAXNS) pre-filled financial data and projections.
- Step 3: Adjust key inputs such as revenue growth, WACC, and tax rates (highlighted cells).
- Step 4: Observe the DCF model refresh instantly as you modify your assumptions.
- Step 5: Evaluate the outputs and leverage the findings for your investment choices.
Why Choose This Calculator for Thermax Limited (THERMAXNS)?
- User-Friendly Interface: Tailored for both novice users and seasoned professionals.
- Customizable Inputs: Easily adjust parameters to suit your specific analysis needs.
- Real-Time Calculations: Observe immediate updates to Thermax's valuation as you tweak the inputs.
- Pre-Loaded Data: Featuring Thermax's latest financial figures for swift assessments.
- Endorsed by Experts: A preferred tool among investors and analysts for making well-informed choices.
Who Can Benefit from Thermax Limited (THERMAXNS)?
- Investors: Make informed decisions with a professional-grade valuation tool tailored for Thermax Limited (THERMAXNS).
- Financial Analysts: Save time utilizing a customizable pre-built DCF model specific to Thermax Limited (THERMAXNS).
- Consultants: Easily modify the template for effective client presentations or reports focused on Thermax Limited (THERMAXNS).
- Finance Enthusiasts: Enhance your knowledge of valuation techniques through real-life examples related to Thermax Limited (THERMAXNS).
- Educators and Students: Leverage this resource as a hands-on learning tool in finance courses centered around Thermax Limited (THERMAXNS).
Contents of the Template
- Pre-Filled Data: Contains Thermax Limited's historical financials and projections.
- Discounted Cash Flow Model: An editable DCF valuation model featuring automatic calculations.
- Weighted Average Cost of Capital (WACC): A specific worksheet for computing WACC using customized inputs.
- Key Financial Ratios: Assess Thermax Limited's profitability, efficiency, and leverage metrics.
- Customizable Inputs: Easily adjust revenue growth, margins, and tax rates as needed.
- Clear Dashboard: Visuals and tables that summarize essential valuation outcomes.
Disclaimer
All information, articles, and product details provided on this website are for general informational and educational purposes only. We do not claim any ownership over, nor do we intend to infringe upon, any trademarks, copyrights, logos, brand names, or other intellectual property mentioned or depicted on this site. Such intellectual property remains the property of its respective owners, and any references here are made solely for identification or informational purposes, without implying any affiliation, endorsement, or partnership.
We make no representations or warranties, express or implied, regarding the accuracy, completeness, or suitability of any content or products presented. Nothing on this website should be construed as legal, tax, investment, financial, medical, or other professional advice. In addition, no part of this site—including articles or product references—constitutes a solicitation, recommendation, endorsement, advertisement, or offer to buy or sell any securities, franchises, or other financial instruments, particularly in jurisdictions where such activity would be unlawful.
All content is of a general nature and may not address the specific circumstances of any individual or entity. It is not a substitute for professional advice or services. Any actions you take based on the information provided here are strictly at your own risk. You accept full responsibility for any decisions or outcomes arising from your use of this website and agree to release us from any liability in connection with your use of, or reliance upon, the content or products found herein.