
|
Up Fintech Holding Limited (TIGR) DCF VALUATION |
Entièrement Modifiable: Adapté À Vos Besoins Dans Excel Ou Sheets
Conception Professionnelle: Modèles Fiables Et Conformes Aux Normes Du Secteur
Pré-Construits Pour Une Utilisation Rapide Et Efficace
Compatible MAC/PC, entièrement débloqué
Aucune Expertise N'Est Requise; Facile À Suivre
UP Fintech Holding Limited (TIGR) Bundle
Vous cherchez à calculer la valeur intrinsèque de UP Fintech Holding Limited? Notre calculatrice (TIGR) DCF intègre des données réelles avec des fonctionnalités de personnalisation étendues, vous permettant d'affiner vos prévisions et d'améliorer vos stratégies d'investissement.
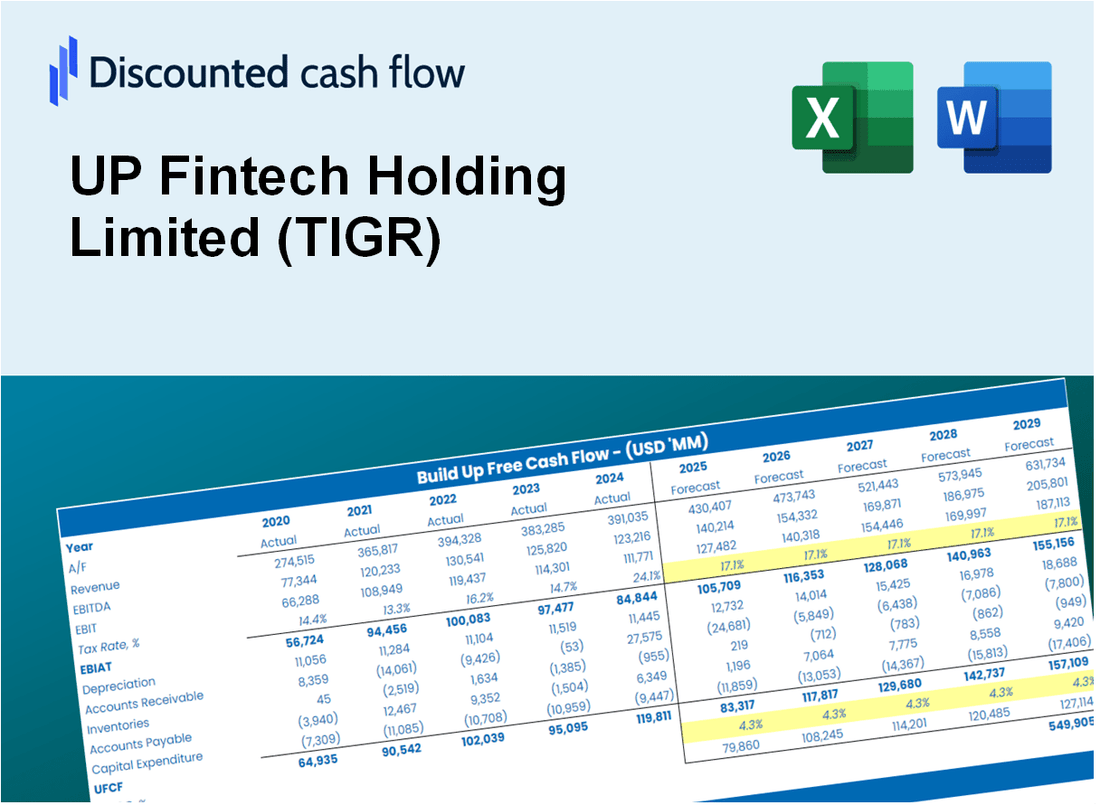
Discounted Cash Flow (DCF) - (USD MM)
| Year | AY1 2020 |
AY2 2021 |
AY3 2022 |
AY4 2023 |
AY5 2024 |
FY1 2025 |
FY2 2026 |
FY3 2027 |
FY4 2028 |
FY5 2029 |
|---|---|---|---|---|---|---|---|---|---|---|
| Revenue | 140.8 | 264.5 | 225.4 | 272.5 | 391.5 | 526.3 | 707.3 | 950.7 | 1,277.9 | 1,717.6 |
| Revenue Growth, % | 0 | 87.83 | -14.79 | 20.92 | 43.68 | 34.41 | 34.41 | 34.41 | 34.41 | 34.41 |
| EBITDA | 24.3 | 19.0 | 4.5 | 82.6 | 141.9 | 97.9 | 131.6 | 176.9 | 237.7 | 319.5 |
| EBITDA, % | 17.28 | 7.18 | 1.98 | 30.33 | 36.24 | 18.6 | 18.6 | 18.6 | 18.6 | 18.6 |
| Depreciation | .9 | 1.3 | 2.7 | 2.8 | 2.6 | 4.3 | 5.8 | 7.8 | 10.5 | 14.1 |
| Depreciation, % | 0.65932 | 0.50625 | 1.22 | 1.04 | 0.67017 | 0.81945 | 0.81945 | 0.81945 | 0.81945 | 0.81945 |
| EBIT | 23.4 | 17.7 | 1.7 | 79.8 | 139.3 | 93.6 | 125.8 | 169.1 | 227.2 | 305.4 |
| EBIT, % | 16.62 | 6.68 | 0.76353 | 29.28 | 35.57 | 17.78 | 17.78 | 17.78 | 17.78 | 17.78 |
| Total Cash | 98.9 | 276.0 | 441.1 | 751.7 | 470.2 | 494.9 | 665.3 | 894.2 | 1,201.8 | 1,615.4 |
| Total Cash, percent | .0 | .0 | .0 | .0 | .0 | .0 | .0 | .0 | .0 | .0 |
| Account Receivables | 1,181.1 | 1,552.4 | 1,611.0 | 1,308.9 | 3,384.2 | 526.3 | 707.3 | 950.7 | 1,277.9 | 1,717.6 |
| Account Receivables, % | 838.78 | 586.93 | 714.82 | 480.33 | 864.32 | 100 | 100 | 100 | 100 | 100 |
| Inventories | 867.9 | 1,431.8 | 1,678.1 | .0 | .0 | 315.8 | 424.4 | 570.4 | 766.7 | 1,030.6 |
| Inventories, % | 616.38 | 541.36 | 744.6 | 0 | 0 | 60 | 60 | 60 | 60 | 60 |
| Accounts Payable | 1,701.3 | 2,510.0 | 3,135.0 | 3,028.1 | 5,489.4 | 526.3 | 707.3 | 950.7 | 1,277.9 | 1,717.6 |
| Accounts Payable, % | 1208.2 | 949 | 1391.08 | 1111.19 | 1402 | 100 | 100 | 100 | 100 | 100 |
| Capital Expenditure | -1.0 | -5.0 | -4.9 | -2.8 | -1.6 | -6.5 | -8.7 | -11.7 | -15.7 | -21.1 |
| Capital Expenditure, % | -0.69464 | -1.88 | -2.17 | -1.01 | -0.39664 | -1.23 | -1.23 | -1.23 | -1.23 | -1.23 |
| Tax Rate, % | 25.73 | 25.73 | 25.73 | 25.73 | 25.73 | 25.73 | 25.73 | 25.73 | 25.73 | 25.73 |
| EBITAT | 17.1 | 13.6 | -1.9 | 56.5 | 103.4 | 55.2 | 74.2 | 99.8 | 134.1 | 180.3 |
| Depreciation | ||||||||||
| Changes in Account Receivables | ||||||||||
| Changes in Inventories | ||||||||||
| Changes in Accounts Payable | ||||||||||
| Capital Expenditure | ||||||||||
| UFCF | -330.7 | -116.4 | 316.2 | 1,929.7 | 490.6 | -2,367.9 | -37.3 | -50.2 | -67.4 | -90.6 |
| WACC, % | 7.28 | 7.43 | 4.83 | 7.21 | 7.33 | 6.82 | 6.82 | 6.82 | 6.82 | 6.82 |
| PV UFCF | ||||||||||
| SUM PV UFCF | -2,407.7 | |||||||||
| Long Term Growth Rate, % | 2.00 | |||||||||
| Free cash flow (T + 1) | -92 | |||||||||
| Terminal Value | -1,919 | |||||||||
| Present Terminal Value | -1,380 | |||||||||
| Enterprise Value | -3,788 | |||||||||
| Net Debt | -214 | |||||||||
| Equity Value | -3,574 | |||||||||
| Diluted Shares Outstanding, MM | 169 | |||||||||
| Equity Value Per Share | -21.16 |
What You Will Get
- Pre-Filled Financial Model: UP Fintech Holding Limited’s actual data enables precise DCF valuation.
- Full Forecast Control: Adjust revenue growth, margins, WACC, and other key drivers.
- Instant Calculations: Automatic updates ensure you see results as you make changes.
- Investor-Ready Template: A refined Excel file designed for professional-grade valuation.
- Customizable and Reusable: Tailored for flexibility, allowing repeated use for detailed forecasts.
Key Features
- Comprehensive Financial Data: UP Fintech Holding Limited's historical financial statements and pre-filled forecasts.
- Customizable Parameters: Modify WACC, tax rates, revenue growth, and EBITDA margins as needed.
- Real-Time Valuation: Observe UP Fintech's intrinsic value recalculating instantly.
- Intuitive Visualizations: Dashboard charts present valuation results and essential metrics clearly.
- Designed for Precision: A robust tool tailored for analysts, investors, and finance professionals.
How It Works
- 1. Access the Template: Download and open the Excel file containing UP Fintech Holding Limited's (TIGR) financial data.
- 2. Modify Assumptions: Adjust critical inputs such as growth projections, WACC, and capital expenditures.
- 3. Analyze Results Immediately: The DCF model automatically computes intrinsic value and NPV based on your inputs.
- 4. Explore Scenarios: Evaluate various forecasts to assess different valuation scenarios.
- 5. Present with Assurance: Deliver professional valuation insights to enhance your decision-making process.
Why Choose UP Fintech Holding Limited (TIGR)?
- Innovative Solutions: Leverage cutting-edge technology for enhanced trading experiences.
- Global Access: Trade across multiple markets with a single platform designed for international investors.
- Robust Security: Advanced security measures ensure your data and investments are protected.
- User-Friendly Interface: Intuitive design makes it easy for both beginners and seasoned traders to navigate.
- Expert Support: Dedicated customer service team available to assist with any inquiries or issues.
Who Should Use This Product?
- Individual Investors: Make informed decisions about buying or selling UP Fintech Holding Limited (TIGR) stock.
- Financial Analysts: Streamline valuation processes with ready-to-use financial models for UP Fintech Holding Limited (TIGR).
- Consultants: Deliver professional valuation insights on UP Fintech Holding Limited (TIGR) to clients quickly and accurately.
- Business Owners: Understand how companies like UP Fintech Holding Limited (TIGR) are valued to guide your own strategy.
- Finance Students: Learn valuation techniques using real-world data and scenarios related to UP Fintech Holding Limited (TIGR).
What the Template Contains
- Pre-Filled Data: Includes UP Fintech Holding Limited’s historical financials and forecasts.
- Discounted Cash Flow Model: Editable DCF valuation model with automatic calculations.
- Weighted Average Cost of Capital (WACC): A dedicated sheet for calculating WACC based on custom inputs.
- Key Financial Ratios: Analyze UP Fintech Holding Limited’s profitability, efficiency, and leverage.
- Customizable Inputs: Edit revenue growth, margins, and tax rates with ease.
- Clear Dashboard: Charts and tables summarizing key valuation results.
Disclaimer
All information, articles, and product details provided on this website are for general informational and educational purposes only. We do not claim any ownership over, nor do we intend to infringe upon, any trademarks, copyrights, logos, brand names, or other intellectual property mentioned or depicted on this site. Such intellectual property remains the property of its respective owners, and any references here are made solely for identification or informational purposes, without implying any affiliation, endorsement, or partnership.
We make no representations or warranties, express or implied, regarding the accuracy, completeness, or suitability of any content or products presented. Nothing on this website should be construed as legal, tax, investment, financial, medical, or other professional advice. In addition, no part of this site—including articles or product references—constitutes a solicitation, recommendation, endorsement, advertisement, or offer to buy or sell any securities, franchises, or other financial instruments, particularly in jurisdictions where such activity would be unlawful.
All content is of a general nature and may not address the specific circumstances of any individual or entity. It is not a substitute for professional advice or services. Any actions you take based on the information provided here are strictly at your own risk. You accept full responsibility for any decisions or outcomes arising from your use of this website and agree to release us from any liability in connection with your use of, or reliance upon, the content or products found herein.