
|
Tian Ruixiang Holdings Ltd (TIRX) Évaluation DCF |
Entièrement Modifiable: Adapté À Vos Besoins Dans Excel Ou Sheets
Conception Professionnelle: Modèles Fiables Et Conformes Aux Normes Du Secteur
Pré-Construits Pour Une Utilisation Rapide Et Efficace
Compatible MAC/PC, entièrement débloqué
Aucune Expertise N'Est Requise; Facile À Suivre
Tian Ruixiang Holdings Ltd (TIRX) Bundle
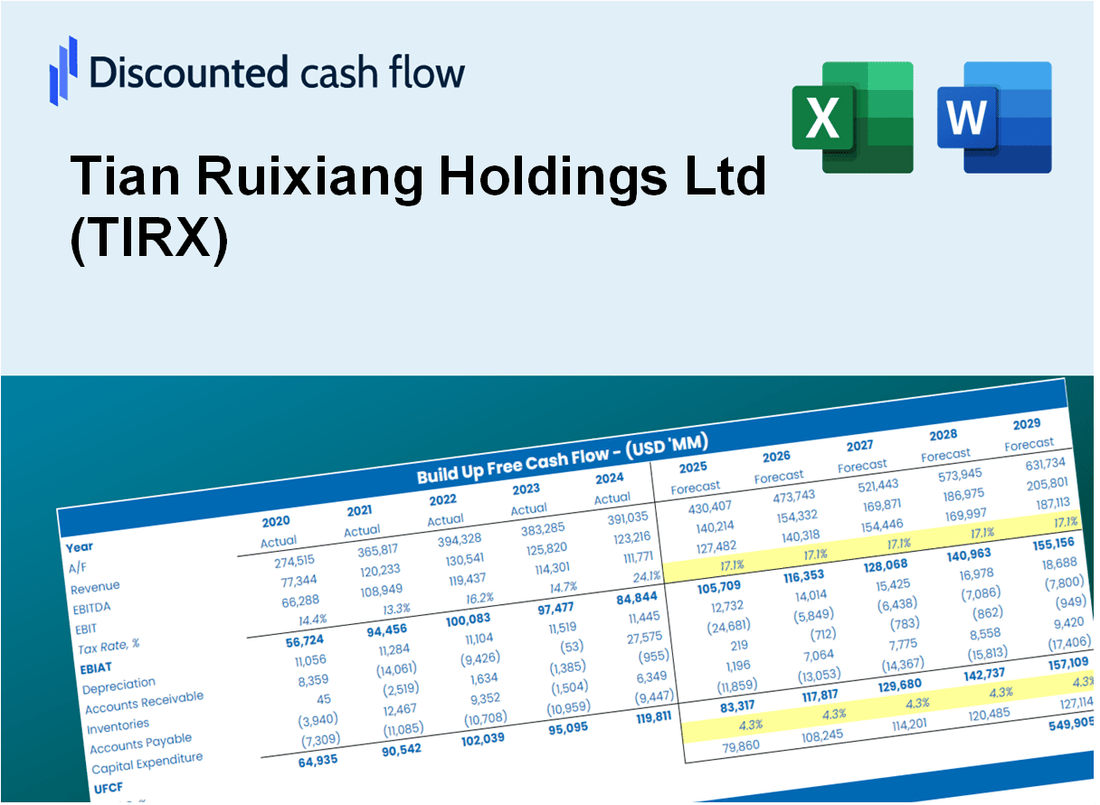
Gardez un aperçu de votre analyse d'évaluation de votre Tian Ruixiang Holdings Ltd (TIRX) en utilisant notre calculatrice sophistiquée DCF! Préchargé avec des données réelles (TIRX), ce modèle Excel vous permet d'ajuster les prévisions et les hypothèses, vous permettant de déterminer la valeur intrinsèque de Tian Ruixiang Holdings Ltd (TIRX) avec précision.
Discounted Cash Flow (DCF) - (USD MM)
| Year | AY1 2020 |
AY2 2021 |
AY3 2022 |
AY4 2023 |
AY5 2024 |
FY1 2025 |
FY2 2026 |
FY3 2027 |
FY4 2028 |
FY5 2029 |
|---|---|---|---|---|---|---|---|---|---|---|
| Revenue | 3.2 | 2.8 | 1.4 | 1.2 | 3.2 | 3.4 | 3.7 | 3.9 | 4.2 | 4.4 |
| Revenue Growth, % | 0 | -14.12 | -51.56 | -7.96 | 158.74 | 6.59 | 6.59 | 6.59 | 6.59 | 6.59 |
| EBITDA | .8 | -2.0 | -4.7 | -2.9 | -2.8 | -2.3 | -2.4 | -2.6 | -2.8 | -3.0 |
| EBITDA, % | 24.24 | -71.62 | -350.39 | -236.01 | -86.95 | -66.87 | -66.87 | -66.87 | -66.87 | -66.87 |
| Depreciation | .2 | .3 | .2 | .1 | .2 | .3 | .3 | .3 | .4 | .4 |
| Depreciation, % | 7 | 9.14 | 15.41 | 6.41 | 5.24 | 8.64 | 8.64 | 8.64 | 8.64 | 8.64 |
| EBIT | .6 | -2.3 | -4.9 | -3.0 | -3.0 | -2.4 | -2.6 | -2.8 | -3.0 | -3.2 |
| EBIT, % | 17.24 | -80.76 | -365.8 | -242.42 | -92.19 | -71.14 | -71.14 | -71.14 | -71.14 | -71.14 |
| Total Cash | 6.1 | 30.0 | 26.2 | 26.8 | 28.4 | 3.4 | 3.7 | 3.9 | 4.2 | 4.4 |
| Total Cash, percent | .0 | .0 | .0 | .0 | .0 | .0 | .0 | .0 | .0 | .0 |
| Account Receivables | 1.2 | .3 | 7.8 | .0 | 10.7 | 1.7 | 1.8 | 2.0 | 2.1 | 2.2 |
| Account Receivables, % | 38.38 | 11.5 | 578.05 | 1.52 | 333.88 | 50.28 | 50.28 | 50.28 | 50.28 | 50.28 |
| Inventories | .0 | .0 | .0 | .0 | .0 | .0 | .0 | .0 | .0 | .0 |
| Inventories, % | 0 | 0 | 0 | 0 | 0 | 0 | 0 | 0 | 0 | 0 |
| Accounts Payable | .0 | .0 | .0 | .0 | .0 | .0 | .0 | .0 | .0 | .0 |
| Accounts Payable, % | 0 | 0 | 0 | 0 | 0 | 0 | 0 | 0 | 0 | 0 |
| Capital Expenditure | .0 | .0 | .0 | .0 | .0 | .0 | .0 | .0 | .0 | .0 |
| Capital Expenditure, % | -0.10639 | -0.12223 | -0.17353 | -0.000321479656 | -0.000124249247 | -0.08051997 | -0.08051997 | -0.08051997 | -0.08051997 | -0.08051997 |
| Tax Rate, % | -1.07 | -1.07 | -1.07 | -1.07 | -1.07 | -1.07 | -1.07 | -1.07 | -1.07 | -1.07 |
| EBITAT | .5 | -2.3 | -5.0 | -3.2 | -3.0 | -2.4 | -2.5 | -2.7 | -2.9 | -3.0 |
| Depreciation | ||||||||||
| Changes in Account Receivables | ||||||||||
| Changes in Inventories | ||||||||||
| Changes in Accounts Payable | ||||||||||
| Capital Expenditure | ||||||||||
| UFCF | -.6 | -1.1 | -12.3 | 4.6 | -13.6 | 7.0 | -2.3 | -2.5 | -2.6 | -2.8 |
| WACC, % | 7.39 | 7.4 | 7.4 | 7.4 | 7.4 | 7.4 | 7.4 | 7.4 | 7.4 | 7.4 |
| PV UFCF | ||||||||||
| SUM PV UFCF | -1.5 | |||||||||
| Long Term Growth Rate, % | 2.00 | |||||||||
| Free cash flow (T + 1) | -3 | |||||||||
| Terminal Value | -53 | |||||||||
| Present Terminal Value | -37 | |||||||||
| Enterprise Value | -39 | |||||||||
| Net Debt | 1 | |||||||||
| Equity Value | -39 | |||||||||
| Diluted Shares Outstanding, MM | 33 | |||||||||
| Equity Value Per Share | -1.20 |
What You Will Receive
- Customizable Excel Template: A fully adjustable Excel-based DCF Calculator featuring pre-filled real TIRX financials.
- Accurate Data: Historical performance data and future estimates (highlighted in the yellow cells).
- Flexible Forecasting: Adjust forecast parameters such as revenue growth, EBITDA %, and WACC.
- Instant Calculations: Quickly observe how your inputs affect the valuation of Tian Ruixiang Holdings Ltd (TIRX).
- Professional Resource: Designed for investors, CFOs, consultants, and financial analysts.
- Intuitive Layout: Organized for clarity and user-friendliness, complete with step-by-step guidance.
Key Features
- Accurate Financial Data for TIRX: Access reliable pre-loaded historical figures and future forecasts for Tian Ruixiang Holdings Ltd (TIRX).
- Tailored Forecast Assumptions: Modify highlighted cells for key metrics like WACC, growth rates, and profit margins.
- Real-Time Calculations: Automatic adjustments to DCF, Net Present Value (NPV), and cash flow evaluations.
- User-Friendly Dashboard: Clear charts and summaries to easily interpret your valuation outcomes.
- Designed for All Users: An intuitive layout suitable for investors, CFOs, and consultants alike.
How It Works
- Step 1: Download the Excel file.
- Step 2: Review pre-entered Tian Ruixiang Holdings Ltd (TIRX) data (historical and projected).
- Step 3: Adjust key assumptions (yellow cells) based on your analysis.
- Step 4: View automatic recalculations for Tian Ruixiang Holdings Ltd (TIRX)’s intrinsic value.
- Step 5: Use the outputs for investment decisions or reporting.
Why Choose This Calculator for Tian Ruixiang Holdings Ltd (TIRX)?
- Accurate Data: Utilize real financial metrics from Tian Ruixiang for trustworthy valuation outcomes.
- Customizable: Tailor essential parameters such as growth rates, WACC, and tax rates to fit your forecasts.
- Time-Saving: Built-in calculations allow you to bypass starting from the ground up.
- Professional-Grade Tool: Crafted specifically for investors, analysts, and consultants.
- User-Friendly: The intuitive design and guided instructions make it accessible for all users.
Who Should Use This Product?
- Investors: Assess Tian Ruixiang Holdings Ltd's (TIRX) valuation prior to making investment decisions.
- CFOs and Financial Analysts: Optimize valuation methodologies and evaluate financial forecasts for TIRX.
- Startup Founders: Understand the valuation practices of established companies like Tian Ruixiang Holdings Ltd (TIRX).
- Consultants: Provide detailed valuation assessments for clients involving TIRX.
- Students and Educators: Utilize practical data from Tian Ruixiang Holdings Ltd (TIRX) to enhance learning of valuation strategies.
What the Template Contains
- Comprehensive DCF Model: Editable template featuring detailed valuation calculations for Tian Ruixiang Holdings Ltd (TIRX).
- Real-World Data: Historical and projected financials for Tian Ruixiang Holdings Ltd (TIRX) preloaded for in-depth analysis.
- Customizable Parameters: Modify WACC, growth rates, and tax assumptions to explore different scenarios.
- Financial Statements: Complete annual and quarterly breakdowns to provide deeper insights into the company's performance.
- Key Ratios: Integrated analysis for profitability, efficiency, and leverage metrics specific to Tian Ruixiang Holdings Ltd (TIRX).
- Dashboard with Visual Outputs: Visual representations including charts and tables for clear, actionable insights.
Disclaimer
All information, articles, and product details provided on this website are for general informational and educational purposes only. We do not claim any ownership over, nor do we intend to infringe upon, any trademarks, copyrights, logos, brand names, or other intellectual property mentioned or depicted on this site. Such intellectual property remains the property of its respective owners, and any references here are made solely for identification or informational purposes, without implying any affiliation, endorsement, or partnership.
We make no representations or warranties, express or implied, regarding the accuracy, completeness, or suitability of any content or products presented. Nothing on this website should be construed as legal, tax, investment, financial, medical, or other professional advice. In addition, no part of this site—including articles or product references—constitutes a solicitation, recommendation, endorsement, advertisement, or offer to buy or sell any securities, franchises, or other financial instruments, particularly in jurisdictions where such activity would be unlawful.
All content is of a general nature and may not address the specific circumstances of any individual or entity. It is not a substitute for professional advice or services. Any actions you take based on the information provided here are strictly at your own risk. You accept full responsibility for any decisions or outcomes arising from your use of this website and agree to release us from any liability in connection with your use of, or reliance upon, the content or products found herein.