
|
Titan Company Limited (Titan.NS) Évaluation DCF |
Entièrement Modifiable: Adapté À Vos Besoins Dans Excel Ou Sheets
Conception Professionnelle: Modèles Fiables Et Conformes Aux Normes Du Secteur
Pré-Construits Pour Une Utilisation Rapide Et Efficace
Compatible MAC/PC, entièrement débloqué
Aucune Expertise N'Est Requise; Facile À Suivre
Titan Company Limited (TITAN.NS) Bundle
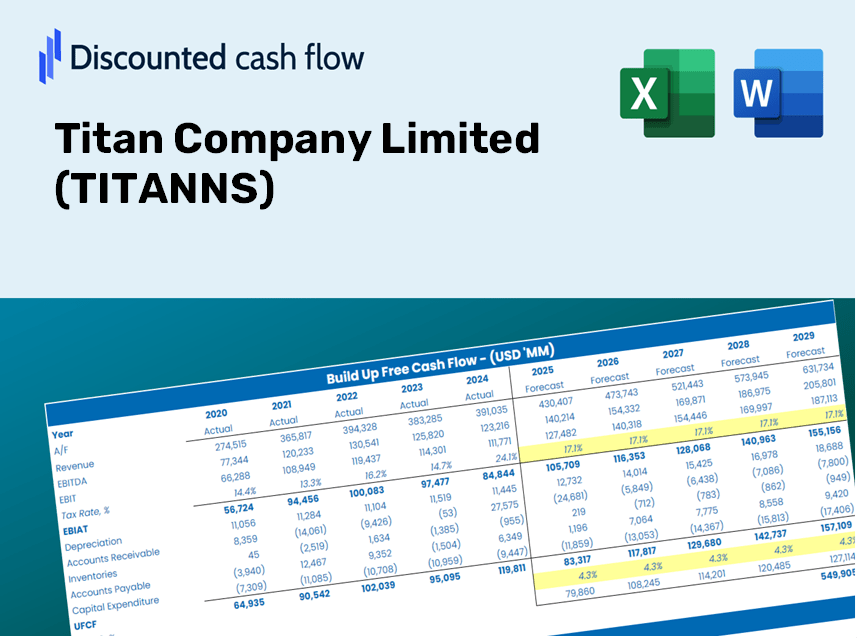
Explorez le potentiel financier de Titan Company Limited (Titanns) avec notre calculatrice DCF conviviale! Entrez simplement vos hypothèses de croissance, de marges et de coûts pour calculer la valeur intrinsèque de Titan Company Limited (Titanns) et améliorer votre stratégie d'investissement.
What You Will Gain
- Authentic Titan Data: Preloaded financial information – encompassing everything from revenue to EBIT – derived from actual and forecasted figures.
- Complete Customization: Modify all key parameters (yellow cells) such as WACC, growth %, and tax rates.
- Immediate Valuation Adjustments: Automatic recalculations to assess the effect of changes on Titan's fair value.
- Flexible Excel Template: Designed for quick modifications, scenario analysis, and comprehensive projections.
- Efficient and Precise: Avoid the hassle of building models from the ground up while ensuring accuracy and adaptability.
Key Features
- Genuine TITANNS Data: Comes pre-loaded with Titan Company Limited's historical financial performance and future projections.
- Completely Customizable Inputs: Modify parameters such as revenue growth, profit margins, WACC, tax rates, and capital expenditures.
- Interactive Valuation Model: Instantly recalculates Net Present Value (NPV) and intrinsic value based on your input values.
- Scenario Analysis: Develop multiple forecasting scenarios to explore various valuation results.
- Intuitive Design: Easy-to-use interface tailored for both professionals and newcomers.
How It Operates
- Download: Obtain the pre-built Excel file featuring Titan Company Limited’s financial data.
- Customize: Modify projections, such as revenue growth, EBITDA %, and WACC.
- Update Automatically: Real-time updates for intrinsic value and NPV calculations.
- Test Scenarios: Generate various forecasts and compare results instantly.
- Make Decisions: Leverage the valuation outcomes to inform your investment strategy.
Why Opt for Titan Company's Calculator?
- Time Efficient: Skip the hassle of building a DCF model from the ground up – it’s immediately available for use.
- Enhanced Precision: Dependable financial data and formulas minimize valuation errors.
- Completely Customizable: Adjust the model to align with your specific assumptions and forecasts.
- User-Friendly: Intuitive charts and outputs make it simple to interpret the results.
- Endorsed by Professionals: Crafted for experts who prioritize accuracy and functionality.
Who Should Utilize This Product?
- Investors: Assess the fair value of Titan Company Limited (TITANNS) to make informed investment choices.
- CFOs: Utilize a high-quality DCF model for precise financial reporting and analysis.
- Consultants: Seamlessly customize the template for client valuation reports.
- Entrepreneurs: Acquire valuable insights into the financial modeling practices of leading companies.
- Educators: Leverage it as a pedagogical resource to illustrate valuation techniques.
Contents of the Template
- Pre-Filled DCF Model: Titan Company Limited’s financial data is preloaded for immediate utilization.
- WACC Calculator: Comprehensive calculations for the Weighted Average Cost of Capital.
- Financial Ratios: Analyze Titan's profitability, leverage, and operational efficiency.
- Editable Inputs: Adjust assumptions such as growth rates, profit margins, and capital expenditures to suit your analysis.
- Financial Statements: Access annual and quarterly reports for thorough examination.
- Interactive Dashboard: Conveniently visualize essential valuation metrics and outcomes.
Disclaimer
All information, articles, and product details provided on this website are for general informational and educational purposes only. We do not claim any ownership over, nor do we intend to infringe upon, any trademarks, copyrights, logos, brand names, or other intellectual property mentioned or depicted on this site. Such intellectual property remains the property of its respective owners, and any references here are made solely for identification or informational purposes, without implying any affiliation, endorsement, or partnership.
We make no representations or warranties, express or implied, regarding the accuracy, completeness, or suitability of any content or products presented. Nothing on this website should be construed as legal, tax, investment, financial, medical, or other professional advice. In addition, no part of this site—including articles or product references—constitutes a solicitation, recommendation, endorsement, advertisement, or offer to buy or sell any securities, franchises, or other financial instruments, particularly in jurisdictions where such activity would be unlawful.
All content is of a general nature and may not address the specific circumstances of any individual or entity. It is not a substitute for professional advice or services. Any actions you take based on the information provided here are strictly at your own risk. You accept full responsibility for any decisions or outcomes arising from your use of this website and agree to release us from any liability in connection with your use of, or reliance upon, the content or products found herein.