
|
L'évaluation DCF TJX Companies, Inc. (TJX) |
Entièrement Modifiable: Adapté À Vos Besoins Dans Excel Ou Sheets
Conception Professionnelle: Modèles Fiables Et Conformes Aux Normes Du Secteur
Pré-Construits Pour Une Utilisation Rapide Et Efficace
Compatible MAC/PC, entièrement débloqué
Aucune Expertise N'Est Requise; Facile À Suivre
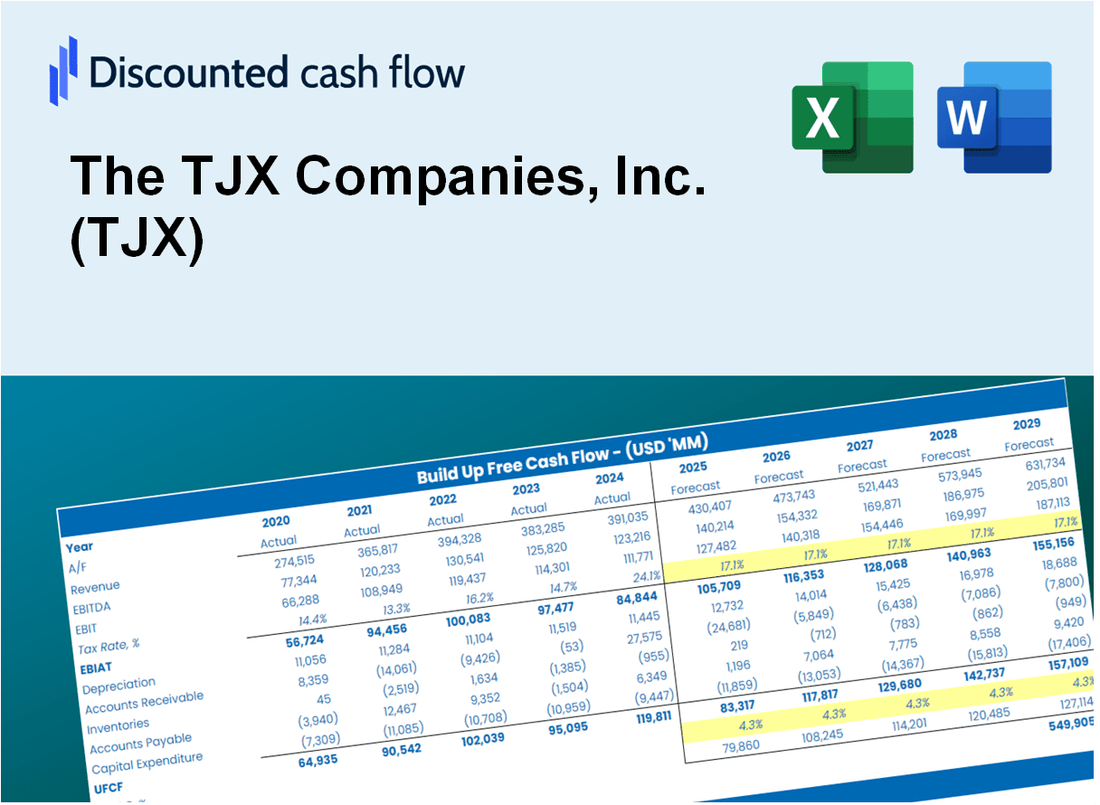
The TJX Companies, Inc. (TJX) Bundle
Simplifiez l'évaluation TJX Companies, Inc. (TJX) avec cette calculatrice DCF personnalisable! Doté de véritables entrées de Financial TJX et de prévisions réglables, vous pouvez tester les scénarios et découvrir la juste valeur de TJX en quelques minutes.
Discounted Cash Flow (DCF) - (USD MM)
| Year | AY1 2021 |
AY2 2022 |
AY3 2023 |
AY4 2024 |
AY5 2025 |
FY1 2026 |
FY2 2027 |
FY3 2028 |
FY4 2029 |
FY5 2030 |
|---|---|---|---|---|---|---|---|---|---|---|
| Revenue | 32,137.0 | 48,550.0 | 49,936.0 | 54,217.0 | 56,360.0 | 65,723.1 | 76,641.8 | 89,374.4 | 104,222.2 | 121,536.7 |
| Revenue Growth, % | 0 | 51.07 | 2.85 | 8.57 | 3.95 | 16.61 | 16.61 | 16.61 | 16.61 | 16.61 |
| EBITDA | 1,154.0 | 5,385.0 | 5,607.0 | 7,010.0 | 7,663.0 | 6,892.6 | 8,037.7 | 9,373.0 | 10,930.2 | 12,746.0 |
| EBITDA, % | 3.59 | 11.09 | 11.23 | 12.93 | 13.6 | 10.49 | 10.49 | 10.49 | 10.49 | 10.49 |
| Depreciation | 871.0 | 868.0 | 887.0 | 964.0 | 1,104.0 | 1,315.9 | 1,534.6 | 1,789.5 | 2,086.8 | 2,433.5 |
| Depreciation, % | 2.71 | 1.79 | 1.78 | 1.78 | 1.96 | 2 | 2 | 2 | 2 | 2 |
| EBIT | 283.0 | 4,517.0 | 4,720.0 | 6,046.0 | 6,559.0 | 5,576.7 | 6,503.2 | 7,583.5 | 8,843.4 | 10,312.6 |
| EBIT, % | 0.8806 | 9.3 | 9.45 | 11.15 | 11.64 | 8.49 | 8.49 | 8.49 | 8.49 | 8.49 |
| Total Cash | 10,469.6 | 6,227.0 | 5,477.0 | 5,600.0 | 5,335.0 | 10,011.8 | 11,675.1 | 13,614.7 | 15,876.5 | 18,514.1 |
| Total Cash, percent | .0 | .0 | .0 | .0 | .0 | .0 | .0 | .0 | .0 | .0 |
| Account Receivables | 497.4 | 633.0 | 682.0 | 588.0 | 618.0 | 841.0 | 980.8 | 1,143.7 | 1,333.7 | 1,555.3 |
| Account Receivables, % | 1.55 | 1.3 | 1.37 | 1.08 | 1.1 | 1.28 | 1.28 | 1.28 | 1.28 | 1.28 |
| Inventories | 4,337.4 | 5,962.0 | 5,819.0 | 5,965.0 | 6,421.0 | 7,863.7 | 9,170.1 | 10,693.6 | 12,470.1 | 14,541.8 |
| Inventories, % | 13.5 | 12.28 | 11.65 | 11 | 11.39 | 11.96 | 11.96 | 11.96 | 11.96 | 11.96 |
| Accounts Payable | 4,823.4 | 4,465.0 | 3,794.0 | 3,862.0 | 4,257.0 | 6,109.6 | 7,124.6 | 8,308.2 | 9,688.4 | 11,298.0 |
| Accounts Payable, % | 15.01 | 9.2 | 7.6 | 7.12 | 7.55 | 9.3 | 9.3 | 9.3 | 9.3 | 9.3 |
| Capital Expenditure | -568.0 | -1,044.8 | -1,457.0 | -1,722.0 | -1,918.0 | -1,763.5 | -2,056.5 | -2,398.2 | -2,796.6 | -3,261.2 |
| Capital Expenditure, % | -1.77 | -2.15 | -2.92 | -3.18 | -3.4 | -2.68 | -2.68 | -2.68 | -2.68 | -2.68 |
| Tax Rate, % | 24.97 | 24.97 | 24.97 | 24.97 | 24.97 | 24.97 | 24.97 | 24.97 | 24.97 | 24.97 |
| EBITAT | 286.2 | 3,371.8 | 3,561.4 | 4,533.2 | 4,921.0 | 4,462.5 | 5,203.9 | 6,068.4 | 7,076.6 | 8,252.2 |
| Depreciation | ||||||||||
| Changes in Account Receivables | ||||||||||
| Changes in Inventories | ||||||||||
| Changes in Accounts Payable | ||||||||||
| Capital Expenditure | ||||||||||
| UFCF | 577.8 | 1,076.4 | 2,414.4 | 3,791.2 | 4,016.0 | 4,201.8 | 4,250.8 | 4,957.0 | 5,780.5 | 6,740.9 |
| WACC, % | 7.11 | 7.04 | 7.05 | 7.04 | 7.04 | 7.06 | 7.06 | 7.06 | 7.06 | 7.06 |
| PV UFCF | ||||||||||
| SUM PV UFCF | 20,866.8 | |||||||||
| Long Term Growth Rate, % | 3.00 | |||||||||
| Free cash flow (T + 1) | 6,943 | |||||||||
| Terminal Value | 171,084 | |||||||||
| Present Terminal Value | 121,649 | |||||||||
| Enterprise Value | 142,516 | |||||||||
| Net Debt | 7,443 | |||||||||
| Equity Value | 135,073 | |||||||||
| Diluted Shares Outstanding, MM | 1,142 | |||||||||
| Equity Value Per Share | 118.28 |
What You Will Get
- Real TJX Data: Preloaded financials – from revenue to EBIT – based on actual and projected figures for The TJX Companies, Inc. (TJX).
- Full Customization: Adjust all critical parameters (yellow cells) like WACC, growth %, and tax rates specifically for TJX.
- Instant Valuation Updates: Automatic recalculations to analyze the impact of changes on The TJX Companies, Inc.'s (TJX) fair value.
- Versatile Excel Template: Tailored for quick edits, scenario testing, and detailed projections for TJX.
- Time-Saving and Accurate: Skip building models from scratch while maintaining precision and flexibility for The TJX Companies, Inc. (TJX).
Key Features
- Real-Life TJX Data: Pre-filled with The TJX Companies, Inc.'s historical financials and forward-looking projections.
- Fully Customizable Inputs: Adjust revenue growth, margins, WACC, tax rates, and capital expenditures.
- Dynamic Valuation Model: Automatic updates to Net Present Value (NPV) and intrinsic value based on your inputs.
- Scenario Testing: Create multiple forecast scenarios to analyze different valuation outcomes.
- User-Friendly Design: Simple, structured, and designed for professionals and beginners alike.
How It Works
- Step 1: Download the Excel file.
- Step 2: Review pre-entered TJX data (historical and projected).
- Step 3: Adjust key assumptions (yellow cells) based on your analysis.
- Step 4: View automatic recalculations for TJX’s intrinsic value.
- Step 5: Use the outputs for investment decisions or reporting.
Why Choose This Calculator for The TJX Companies, Inc. (TJX)?
- User-Friendly Interface: Tailored for both novice and seasoned users.
- Customizable Inputs: Adjust parameters easily to suit your financial analysis.
- Real-Time Insights: Watch The TJX Companies’ valuation update instantly as you change inputs.
- Preloaded Data: Comes with The TJX Companies' actual financial information for immediate evaluation.
- Relied Upon by Experts: Favored by investors and analysts for making well-informed choices.
Who Should Use This Product?
- Retail Analysts: Develop comprehensive and accurate valuation models for TJX portfolio assessments.
- Corporate Finance Teams: Evaluate valuation scenarios to inform strategic decisions within the organization.
- Consultants and Advisors: Deliver precise valuation insights for TJX stock to clients.
- Students and Educators: Utilize real-world data to enhance learning and practice in financial modeling.
- Market Enthusiasts: Gain insights into how retail giants like TJX are valued in the marketplace.
What the Template Contains
- Preloaded TJX Data: Historical and projected financial data, including revenue, EBIT, and capital expenditures.
- DCF and WACC Models: Professional-grade sheets for calculating intrinsic value and Weighted Average Cost of Capital.
- Editable Inputs: Yellow-highlighted cells for adjusting revenue growth, tax rates, and discount rates.
- Financial Statements: Comprehensive annual and quarterly financials for deeper analysis.
- Key Ratios: Profitability, leverage, and efficiency ratios to evaluate performance.
- Dashboard and Charts: Visual summaries of valuation outcomes and assumptions.
Disclaimer
All information, articles, and product details provided on this website are for general informational and educational purposes only. We do not claim any ownership over, nor do we intend to infringe upon, any trademarks, copyrights, logos, brand names, or other intellectual property mentioned or depicted on this site. Such intellectual property remains the property of its respective owners, and any references here are made solely for identification or informational purposes, without implying any affiliation, endorsement, or partnership.
We make no representations or warranties, express or implied, regarding the accuracy, completeness, or suitability of any content or products presented. Nothing on this website should be construed as legal, tax, investment, financial, medical, or other professional advice. In addition, no part of this site—including articles or product references—constitutes a solicitation, recommendation, endorsement, advertisement, or offer to buy or sell any securities, franchises, or other financial instruments, particularly in jurisdictions where such activity would be unlawful.
All content is of a general nature and may not address the specific circumstances of any individual or entity. It is not a substitute for professional advice or services. Any actions you take based on the information provided here are strictly at your own risk. You accept full responsibility for any decisions or outcomes arising from your use of this website and agree to release us from any liability in connection with your use of, or reliance upon, the content or products found herein.