
|
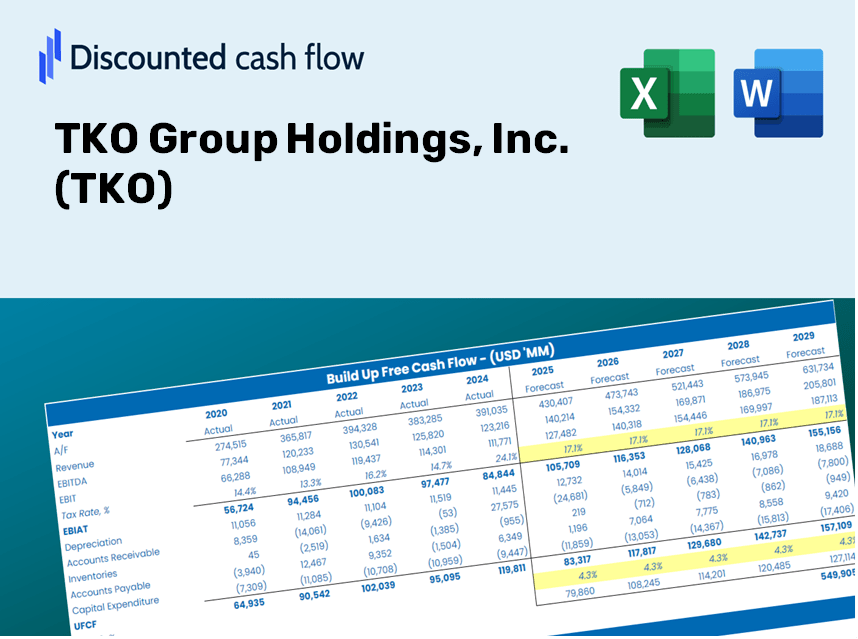
TKO Group Holdings, Inc. (TKO) Évaluation DCF |
Entièrement Modifiable: Adapté À Vos Besoins Dans Excel Ou Sheets
Conception Professionnelle: Modèles Fiables Et Conformes Aux Normes Du Secteur
Pré-Construits Pour Une Utilisation Rapide Et Efficace
Compatible MAC/PC, entièrement débloqué
Aucune Expertise N'Est Requise; Facile À Suivre
TKO Group Holdings, Inc. (TKO) Bundle
Conçu pour la précision, notre calculatrice TKO DCF vous permet d'évaluer l'évaluation TKO Group Holdings, Inc. (TKO) à l'aide de données financières du monde réel, tout en offrant une flexibilité complète pour modifier tous les paramètres essentiels pour améliorer les prévisions.
What You Will Receive
- Authentic TKO Financial Data: Pre-loaded with TKO Group Holdings, Inc.’s historical and projected metrics for accurate analysis.
- Completely Customizable Template: Easily adjust key inputs such as revenue growth, WACC, and EBITDA %.
- Instant Calculations: Witness TKO’s intrinsic value refresh in real-time as you make updates.
- Professional Valuation Tool: Tailored for investors, analysts, and consultants aiming for precise DCF outcomes.
- User-Centric Design: Intuitive layout and straightforward guidance suitable for all skill levels.
Key Features
- Real-Life TKO Data: Pre-filled with TKO Group Holdings, Inc.'s historical financials and forward-looking projections.
- Fully Customizable Inputs: Adjust revenue growth, margins, WACC, tax rates, and capital expenditures tailored to TKO.
- Dynamic Valuation Model: Automatic updates to Net Present Value (NPV) and intrinsic value based on your inputs specific to TKO.
- Scenario Testing: Create multiple forecast scenarios to analyze various valuation outcomes for TKO.
- User-Friendly Design: Simple, structured, and crafted for both professionals and beginners in TKO analysis.
How It Functions
- Step 1: Download the Excel spreadsheet.
- Step 2: Examine TKO Group Holdings, Inc.'s (TKO) pre-filled financial data and projections.
- Step 3: Adjust key inputs such as revenue growth, WACC, and tax rates (highlighted cells).
- Step 4: Observe the DCF model automatically update as you modify your assumptions.
- Step 5: Evaluate the results and apply the findings to your investment strategies.
Why Choose This Calculator for TKO Group Holdings, Inc. (TKO)?
- User-Friendly Interface: Perfect for both novices and seasoned professionals.
- Customizable Inputs: Modify assumptions effortlessly to suit your analysis needs.
- Real-Time Updates: Observe immediate changes to TKO's valuation as you tweak the variables.
- Preloaded Data: Comes equipped with TKO’s actual financial information for swift analysis.
- Valued by Experts: Trusted by investors and analysts for making well-informed decisions.
Who Can Benefit from TKO Group Holdings, Inc. (TKO)?
- Finance Students: Discover valuation methodologies and apply them to real-world scenarios.
- Researchers: Integrate industry models into your academic projects or studies.
- Investors: Validate your hypotheses and evaluate valuation results for TKO stock.
- Financial Analysts: Enhance your efficiency with a ready-to-use, customizable DCF model.
- Entrepreneurs: Learn how large publicly traded companies like TKO are assessed in the financial landscape.
Contents of the Template
- Pre-Filled Data: Contains historical financials and projections for TKO Group Holdings, Inc. (TKO).
- Discounted Cash Flow Model: Editable DCF valuation model featuring automatic calculations.
- Weighted Average Cost of Capital (WACC): A dedicated worksheet for computing WACC based on user-defined inputs.
- Key Financial Ratios: Evaluate TKO's profitability, efficiency, and leverage metrics.
- Customizable Inputs: Easily modify revenue growth rates, margins, and tax percentages.
- Clear Dashboard: Visual summaries of key valuation outcomes through charts and tables.
Disclaimer
All information, articles, and product details provided on this website are for general informational and educational purposes only. We do not claim any ownership over, nor do we intend to infringe upon, any trademarks, copyrights, logos, brand names, or other intellectual property mentioned or depicted on this site. Such intellectual property remains the property of its respective owners, and any references here are made solely for identification or informational purposes, without implying any affiliation, endorsement, or partnership.
We make no representations or warranties, express or implied, regarding the accuracy, completeness, or suitability of any content or products presented. Nothing on this website should be construed as legal, tax, investment, financial, medical, or other professional advice. In addition, no part of this site—including articles or product references—constitutes a solicitation, recommendation, endorsement, advertisement, or offer to buy or sell any securities, franchises, or other financial instruments, particularly in jurisdictions where such activity would be unlawful.
All content is of a general nature and may not address the specific circumstances of any individual or entity. It is not a substitute for professional advice or services. Any actions you take based on the information provided here are strictly at your own risk. You accept full responsibility for any decisions or outcomes arising from your use of this website and agree to release us from any liability in connection with your use of, or reliance upon, the content or products found herein.