
|
Tencent Music Entertainment Group (TME) DCF Valation |
Entièrement Modifiable: Adapté À Vos Besoins Dans Excel Ou Sheets
Conception Professionnelle: Modèles Fiables Et Conformes Aux Normes Du Secteur
Pré-Construits Pour Une Utilisation Rapide Et Efficace
Compatible MAC/PC, entièrement débloqué
Aucune Expertise N'Est Requise; Facile À Suivre
Tencent Music Entertainment Group (TME) Bundle
Simplifiez l'évaluation du groupe de divertissement de musique Tencent (TME) avec cette calculatrice DCF personnalisable! Doté de Real Tencent Music Entertainment Group (TME) Financials and Rajuscable Forecast Intarts, vous pouvez tester les scénarios et découvrir la juste valeur Tencent Music Entertainment Group (TME) en minutes.
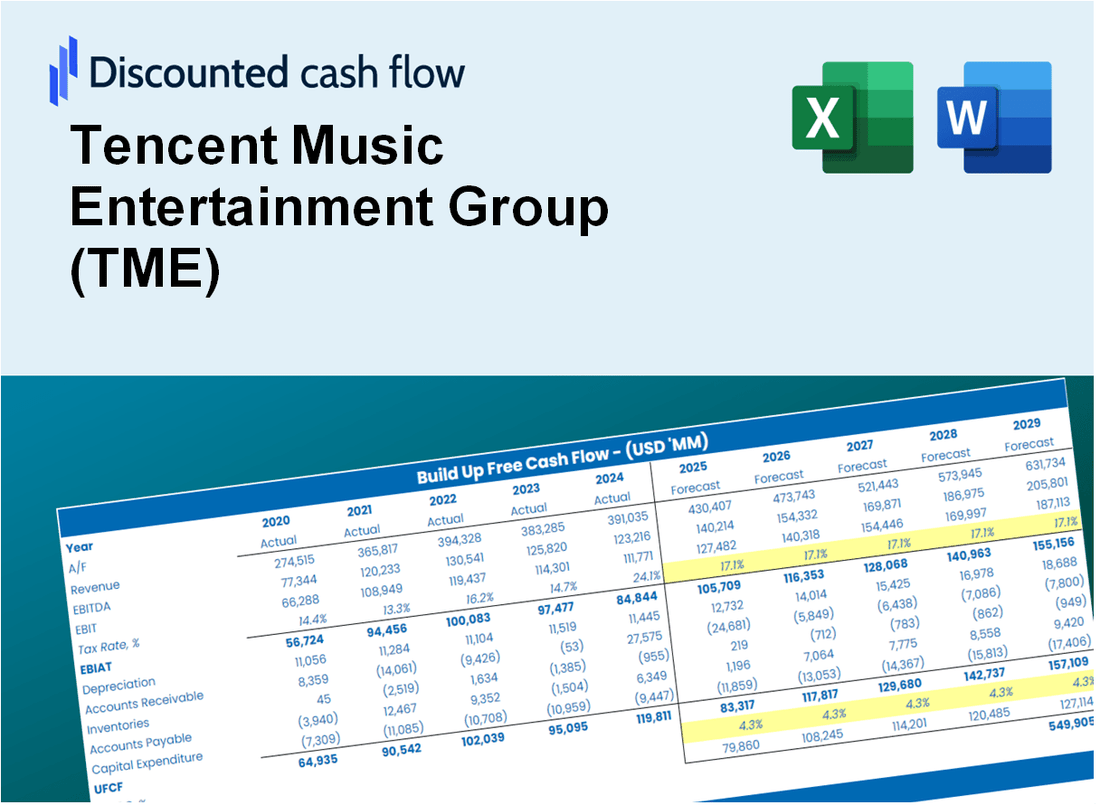
Discounted Cash Flow (DCF) - (USD MM)
| Year | AY1 2020 |
AY2 2021 |
AY3 2022 |
AY4 2023 |
AY5 2024 |
FY1 2025 |
FY2 2026 |
FY3 2027 |
FY4 2028 |
FY5 2029 |
|---|---|---|---|---|---|---|---|---|---|---|
| Revenue | 4,094.5 | 4,388.2 | 3,980.2 | 3,897.8 | 3,988.9 | 3,970.4 | 3,951.9 | 3,933.6 | 3,915.3 | 3,897.1 |
| Revenue Growth, % | 0 | 7.17 | -9.3 | -2.07 | 2.34 | -0.46452 | -0.46452 | -0.46452 | -0.46452 | -0.46452 |
| EBITDA | 780.2 | 667.6 | 793.3 | 803.2 | 1,156.5 | 824.2 | 820.4 | 816.6 | 812.8 | 809.0 |
| EBITDA, % | 19.05 | 15.21 | 19.93 | 20.61 | 28.99 | 20.76 | 20.76 | 20.76 | 20.76 | 20.76 |
| Depreciation | 115.7 | 140.6 | 162.9 | 101.1 | 101.1 | 121.1 | 120.6 | 120.0 | 119.4 | 118.9 |
| Depreciation, % | 2.83 | 3.2 | 4.09 | 2.59 | 2.54 | 3.05 | 3.05 | 3.05 | 3.05 | 3.05 |
| EBIT | 664.5 | 527.0 | 630.3 | 702.1 | 1,055.3 | 703.1 | 699.8 | 696.6 | 693.4 | 690.1 |
| EBIT, % | 16.23 | 12.01 | 15.84 | 18.01 | 26.46 | 17.71 | 17.71 | 17.71 | 17.71 | 17.71 |
| Total Cash | 3,654.9 | 2,868.8 | 2,933.0 | 3,306.3 | 3,821.5 | 3,247.4 | 3,232.4 | 3,217.3 | 3,202.4 | 3,187.5 |
| Total Cash, percent | .0 | .0 | .0 | .0 | .0 | .0 | .0 | .0 | .0 | .0 |
| Account Receivables | 419.7 | 533.3 | 410.5 | 409.8 | 492.7 | 441.4 | 439.3 | 437.3 | 435.2 | 433.2 |
| Account Receivables, % | 10.25 | 12.15 | 10.31 | 10.51 | 12.35 | 11.12 | 11.12 | 11.12 | 11.12 | 11.12 |
| Inventories | 2.5 | 3.4 | 2.0 | 1.1 | 3.2 | 2.4 | 2.4 | 2.3 | 2.3 | 2.3 |
| Inventories, % | 0.06174322 | 0.07681475 | 0.04940188 | 0.02882675 | 0.08098306 | 0.05955393 | 0.05955393 | 0.05955393 | 0.05955393 | 0.05955393 |
| Accounts Payable | 500.7 | 608.0 | 702.0 | 703.1 | 966.2 | 682.7 | 679.6 | 676.4 | 673.3 | 670.1 |
| Accounts Payable, % | 12.23 | 13.86 | 17.64 | 18.04 | 24.22 | 17.2 | 17.2 | 17.2 | 17.2 | 17.2 |
| Capital Expenditure | -70.4 | -387.4 | -147.9 | -163.5 | -144.9 | -175.4 | -174.6 | -173.8 | -173.0 | -172.2 |
| Capital Expenditure, % | -1.72 | -8.83 | -3.72 | -4.19 | -3.63 | -4.42 | -4.42 | -4.42 | -4.42 | -4.42 |
| Tax Rate, % | 23.74 | 23.74 | 23.74 | 23.74 | 23.74 | 23.74 | 23.74 | 23.74 | 23.74 | 23.74 |
| EBITAT | 596.0 | 439.5 | 530.0 | 571.4 | 804.8 | 583.3 | 580.6 | 577.9 | 575.3 | 572.6 |
| Depreciation | ||||||||||
| Changes in Account Receivables | ||||||||||
| Changes in Inventories | ||||||||||
| Changes in Accounts Payable | ||||||||||
| Capital Expenditure | ||||||||||
| UFCF | 719.9 | 185.5 | 763.2 | 511.8 | 939.1 | 297.8 | 525.5 | 523.0 | 520.6 | 518.2 |
| WACC, % | 5.95 | 5.94 | 5.94 | 5.94 | 5.93 | 5.94 | 5.94 | 5.94 | 5.94 | 5.94 |
| PV UFCF | ||||||||||
| SUM PV UFCF | 1,990.9 | |||||||||
| Long Term Growth Rate, % | 3.00 | |||||||||
| Free cash flow (T + 1) | 534 | |||||||||
| Terminal Value | 18,157 | |||||||||
| Present Terminal Value | 13,606 | |||||||||
| Enterprise Value | 15,597 | |||||||||
| Net Debt | -999 | |||||||||
| Equity Value | 16,596 | |||||||||
| Diluted Shares Outstanding, MM | 783 | |||||||||
| Equity Value Per Share | 21.20 |
What You Will Get
- Real TME Financial Data: Pre-filled with Tencent Music’s historical and projected data for precise analysis.
- Fully Editable Template: Modify key inputs like revenue growth, WACC, and EBITDA % with ease.
- Automatic Calculations: See Tencent Music’s intrinsic value update instantly based on your changes.
- Professional Valuation Tool: Designed for investors, analysts, and consultants seeking accurate DCF results.
- User-Friendly Design: Simple structure and clear instructions for all experience levels.
Key Features
- Comprehensive TME Financials: Gain access to precise pre-loaded historical data and future forecasts for Tencent Music Entertainment Group (TME).
- Adjustable Forecast Parameters: Modify highlighted fields such as WACC, growth rates, and profit margins.
- Real-Time Calculations: Automatic updates for DCF, Net Present Value (NPV), and cash flow assessments.
- User-Friendly Dashboard: Clear charts and summaries to help visualize your valuation outcomes.
- Designed for All Skill Levels: An intuitive layout tailored for investors, CFOs, and consultants alike.
How It Works
- Download: Obtain the pre-formatted Excel file containing Tencent Music Entertainment Group’s (TME) financial data.
- Customize: Modify projections, such as revenue growth, EBITDA %, and WACC.
- Update Automatically: The intrinsic value and NPV calculations refresh in real-time.
- Test Scenarios: Generate various forecasts and instantly compare the results.
- Make Decisions: Leverage the valuation findings to inform your investment approach.
Why Choose This Calculator?
- User-Friendly Interface: Perfect for both novices and seasoned professionals.
- Customizable Inputs: Adjust parameters easily to suit your financial analysis.
- Real-Time Feedback: Observe immediate changes to Tencent Music’s valuation as you modify inputs.
- Preloaded Data: Comes with Tencent Music’s actual financial information for swift evaluations.
- Preferred by Experts: Utilized by investors and analysts for making well-informed choices.
Who Should Use This Product?
- Individual Investors: Make informed decisions about buying or selling Tencent Music Entertainment Group (TME) stock.
- Financial Analysts: Streamline valuation processes with ready-to-use financial models for Tencent Music Entertainment Group (TME).
- Consultants: Deliver professional valuation insights related to Tencent Music Entertainment Group (TME) to clients quickly and accurately.
- Business Owners: Understand how large companies like Tencent Music Entertainment Group (TME) are valued to guide your own strategy.
- Finance Students: Learn valuation techniques using real-world data and scenarios related to Tencent Music Entertainment Group (TME).
What the Template Contains
- Comprehensive DCF Model: Editable template with detailed valuation calculations tailored for Tencent Music Entertainment Group (TME).
- Real-World Data: Tencent Music's historical and projected financials preloaded for thorough analysis.
- Customizable Parameters: Adjust WACC, growth rates, and tax assumptions to explore various scenarios.
- Financial Statements: Complete annual and quarterly breakdowns for enhanced insights.
- Key Ratios: Integrated analysis for profitability, efficiency, and leverage metrics.
- Dashboard with Visual Outputs: Charts and tables designed for clear, actionable results.
Disclaimer
All information, articles, and product details provided on this website are for general informational and educational purposes only. We do not claim any ownership over, nor do we intend to infringe upon, any trademarks, copyrights, logos, brand names, or other intellectual property mentioned or depicted on this site. Such intellectual property remains the property of its respective owners, and any references here are made solely for identification or informational purposes, without implying any affiliation, endorsement, or partnership.
We make no representations or warranties, express or implied, regarding the accuracy, completeness, or suitability of any content or products presented. Nothing on this website should be construed as legal, tax, investment, financial, medical, or other professional advice. In addition, no part of this site—including articles or product references—constitutes a solicitation, recommendation, endorsement, advertisement, or offer to buy or sell any securities, franchises, or other financial instruments, particularly in jurisdictions where such activity would be unlawful.
All content is of a general nature and may not address the specific circumstances of any individual or entity. It is not a substitute for professional advice or services. Any actions you take based on the information provided here are strictly at your own risk. You accept full responsibility for any decisions or outcomes arising from your use of this website and agree to release us from any liability in connection with your use of, or reliance upon, the content or products found herein.