
|
TPG Inc. (TPG) Évaluation DCF |
Entièrement Modifiable: Adapté À Vos Besoins Dans Excel Ou Sheets
Conception Professionnelle: Modèles Fiables Et Conformes Aux Normes Du Secteur
Pré-Construits Pour Une Utilisation Rapide Et Efficace
Compatible MAC/PC, entièrement débloqué
Aucune Expertise N'Est Requise; Facile À Suivre
TPG Inc. (TPG) Bundle
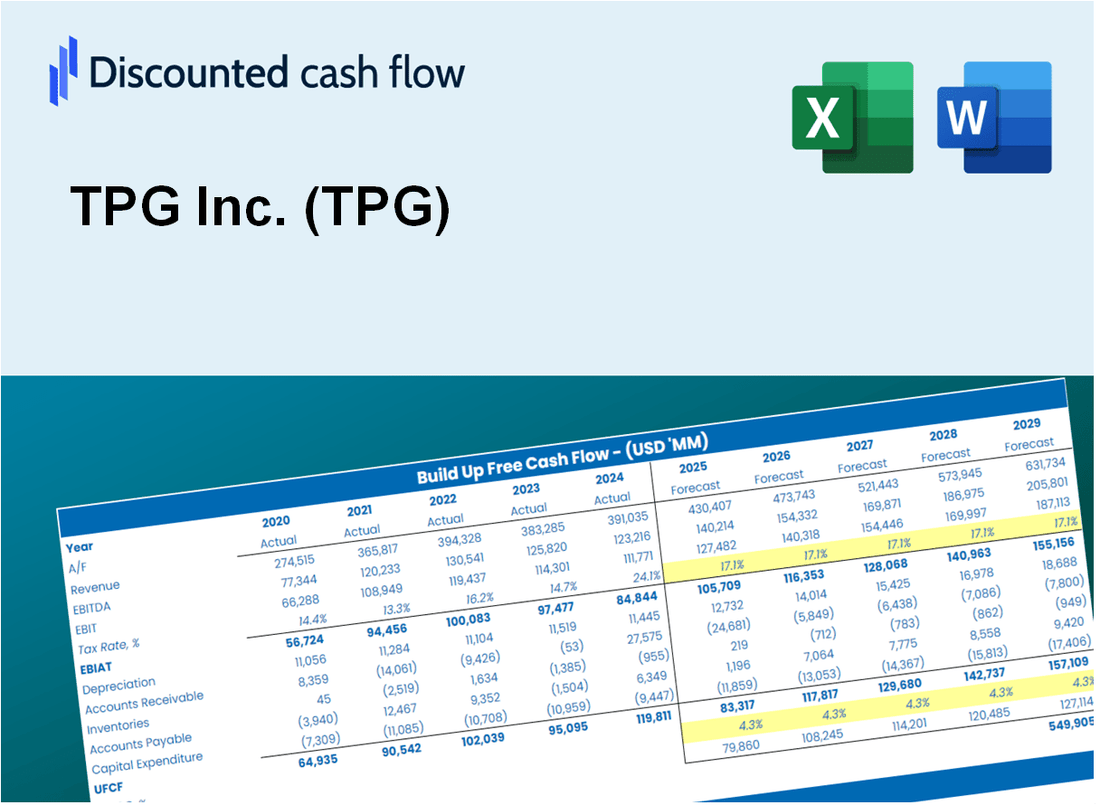
Gardez un aperçu de votre analyse d'évaluation TPG Inc. (TPG) avec notre calculatrice sophistiquée DCF! Ce modèle Excel est préchargé avec de vraies données TPG, vous permettant d'ajuster les prévisions et les hypothèses pour déterminer avec précision la valeur intrinsèque de TPG Inc.
Discounted Cash Flow (DCF) - (USD MM)
| Year | AY1 2020 |
AY2 2021 |
AY3 2022 |
AY4 2023 |
AY5 2024 |
FY1 2025 |
FY2 2026 |
FY3 2027 |
FY4 2028 |
FY5 2029 |
|---|---|---|---|---|---|---|---|---|---|---|
| Revenue | 2,266.3 | 5,581.6 | 1,504.5 | 1,855.8 | 2,623.4 | 3,224.7 | 3,963.7 | 4,872.1 | 5,988.6 | 7,361.1 |
| Revenue Growth, % | 0 | 146.29 | -73.05 | 23.35 | 41.37 | 22.92 | 22.92 | 22.92 | 22.92 | 22.92 |
| EBITDA | 1,455.8 | 4,686.3 | 9.2 | 131.3 | 110.6 | 1,032.6 | 1,269.2 | 1,560.1 | 1,917.6 | 2,357.1 |
| EBITDA, % | 64.24 | 83.96 | 0.61403 | 7.08 | 4.21 | 32.02 | 32.02 | 32.02 | 32.02 | 32.02 |
| Depreciation | 7.1 | 21.2 | 33.0 | 47.7 | 135.4 | 68.5 | 84.2 | 103.5 | 127.2 | 156.3 |
| Depreciation, % | 0.31492 | 0.38023 | 2.19 | 2.57 | 5.16 | 2.12 | 2.12 | 2.12 | 2.12 | 2.12 |
| EBIT | 1,448.7 | 4,665.0 | -23.8 | 83.7 | -24.8 | 964.1 | 1,185.0 | 1,456.6 | 1,790.4 | 2,200.8 |
| EBIT, % | 63.92 | 83.58 | -1.58 | 4.51 | -0.94624 | 29.9 | 29.9 | 29.9 | 29.9 | 29.9 |
| Total Cash | 861.9 | 978.1 | 1,112.6 | 665.2 | 808.0 | 1,265.0 | 1,555.0 | 1,911.3 | 2,349.4 | 2,887.8 |
| Total Cash, percent | .0 | .0 | .0 | .0 | .0 | .0 | .0 | .0 | .0 | .0 |
| Account Receivables | 220.1 | 185.3 | 202.6 | 419.0 | 447.0 | 426.4 | 524.1 | 644.2 | 791.9 | 973.4 |
| Account Receivables, % | 9.71 | 3.32 | 13.47 | 22.58 | 17.04 | 13.22 | 13.22 | 13.22 | 13.22 | 13.22 |
| Inventories | .0 | .0 | .0 | .0 | .0 | .0 | .0 | .0 | .0 | .0 |
| Inventories, % | 0 | 0 | 0 | 0 | 0 | 0 | 0 | 0 | 0 | 0 |
| Accounts Payable | 72.0 | 134.4 | 44.2 | 42.6 | 45.6 | 80.9 | 99.5 | 122.3 | 150.3 | 184.8 |
| Accounts Payable, % | 3.17 | 2.41 | 2.94 | 2.29 | 1.74 | 2.51 | 2.51 | 2.51 | 2.51 | 2.51 |
| Capital Expenditure | -115.5 | -1.8 | -2.4 | -16.7 | -28.1 | -46.9 | -57.6 | -70.8 | -87.0 | -107.0 |
| Capital Expenditure, % | -5.1 | -0.03208757 | -0.16278 | -0.9014 | -1.07 | -1.45 | -1.45 | -1.45 | -1.45 | -1.45 |
| Tax Rate, % | 194.6 | 194.6 | 194.6 | 194.6 | 194.6 | 194.6 | 194.6 | 194.6 | 194.6 | 194.6 |
| EBITAT | 927.6 | 2,180.9 | 92.4 | 80.1 | 23.5 | 398.2 | 489.5 | 601.6 | 739.5 | 909.0 |
| Depreciation | ||||||||||
| Changes in Account Receivables | ||||||||||
| Changes in Inventories | ||||||||||
| Changes in Accounts Payable | ||||||||||
| Capital Expenditure | ||||||||||
| UFCF | 671.1 | 2,297.5 | 15.5 | -106.9 | 105.7 | 475.8 | 436.9 | 537.0 | 660.0 | 811.3 |
| WACC, % | 10.35 | 10.28 | 10.1 | 10.47 | 10.1 | 10.26 | 10.26 | 10.26 | 10.26 | 10.26 |
| PV UFCF | ||||||||||
| SUM PV UFCF | 2,135.8 | |||||||||
| Long Term Growth Rate, % | 2.00 | |||||||||
| Free cash flow (T + 1) | 828 | |||||||||
| Terminal Value | 10,019 | |||||||||
| Present Terminal Value | 6,148 | |||||||||
| Enterprise Value | 8,284 | |||||||||
| Net Debt | 775 | |||||||||
| Equity Value | 7,509 | |||||||||
| Diluted Shares Outstanding, MM | 365 | |||||||||
| Equity Value Per Share | 20.59 |
What You Will Receive
- Adjustable Forecast Parameters: Effortlessly modify key assumptions (growth %, margins, WACC) to explore various scenarios.
- Comprehensive Market Data: TPG Inc.’s financial information pre-loaded to facilitate your analysis.
- Automated DCF Calculations: The template computes Net Present Value (NPV) and intrinsic value automatically.
- Tailored and Professional Design: A refined Excel model that caters to your valuation requirements.
- Designed for Analysts and Investors: Perfect for evaluating projections, confirming strategies, and enhancing efficiency.
Key Features
- Customizable Financial Inputs: Adjust essential parameters such as revenue projections, EBITDA margins, and capital investments.
- Instant DCF Valuation: Quickly computes intrinsic value, NPV, and additional financial metrics.
- High-Precision Accuracy: Leverages TPG Inc.’s (TPG) actual financial data for dependable valuation results.
- Effortless Scenario Analysis: Easily evaluate different scenarios and analyze the resulting impacts.
- Efficiency Booster: Streamline the valuation process without the hassle of creating intricate models from the ground up.
How It Works
- 1. Access the Template: Download and open the Excel file containing TPG Inc.'s preloaded data.
- 2. Modify Assumptions: Adjust key parameters such as growth rates, WACC, and capital expenditures.
- 3. View Results Immediately: The DCF model automatically calculates intrinsic value and NPV.
- 4. Explore Scenarios: Evaluate multiple forecasts to assess various valuation outcomes.
- 5. Present with Assurance: Share professional valuation insights to back your decisions.
Why Choose This Calculator for TPG Inc. (TPG)?
- User-Friendly Interface: Perfectly crafted for both novices and seasoned users.
- Customizable Inputs: Adjust parameters effortlessly to suit your financial evaluations.
- Real-Time Feedback: Observe immediate updates to TPG's valuation as you tweak the inputs.
- Pre-Loaded Data: Comes equipped with TPG's actual financial figures for swift assessments.
- Relied Upon by Experts: A go-to tool for investors and analysts in making strategic choices.
Who Should Use TPG Inc. (TPG)?
- Finance Students: Master financial modeling techniques and apply them with real-world data.
- Academics: Utilize industry-standard models for your research or educational programs.
- Investors: Evaluate your investment strategies and analyze the valuation metrics for TPG Inc. (TPG).
- Analysts: Enhance your analysis process with a customizable financial model tailored for TPG Inc. (TPG).
- Small Business Owners: Understand the valuation methods used for large firms like TPG Inc. (TPG).
What the Template Contains
- Historical Data: Includes TPG Inc.'s (TPG) past financials and baseline forecasts.
- DCF and Levered DCF Models: Detailed templates to calculate TPG Inc.'s (TPG) intrinsic value.
- WACC Sheet: Pre-built calculations for Weighted Average Cost of Capital.
- Editable Inputs: Modify key drivers like growth rates, EBITDA %, and CAPEX assumptions.
- Quarterly and Annual Statements: A complete breakdown of TPG Inc.'s (TPG) financials.
- Interactive Dashboard: Visualize valuation results and projections dynamically.
Disclaimer
All information, articles, and product details provided on this website are for general informational and educational purposes only. We do not claim any ownership over, nor do we intend to infringe upon, any trademarks, copyrights, logos, brand names, or other intellectual property mentioned or depicted on this site. Such intellectual property remains the property of its respective owners, and any references here are made solely for identification or informational purposes, without implying any affiliation, endorsement, or partnership.
We make no representations or warranties, express or implied, regarding the accuracy, completeness, or suitability of any content or products presented. Nothing on this website should be construed as legal, tax, investment, financial, medical, or other professional advice. In addition, no part of this site—including articles or product references—constitutes a solicitation, recommendation, endorsement, advertisement, or offer to buy or sell any securities, franchises, or other financial instruments, particularly in jurisdictions where such activity would be unlawful.
All content is of a general nature and may not address the specific circumstances of any individual or entity. It is not a substitute for professional advice or services. Any actions you take based on the information provided here are strictly at your own risk. You accept full responsibility for any decisions or outcomes arising from your use of this website and agree to release us from any liability in connection with your use of, or reliance upon, the content or products found herein.