
|
Tri Pointe Homes, Inc. (TPH) Évaluation DCF |
Entièrement Modifiable: Adapté À Vos Besoins Dans Excel Ou Sheets
Conception Professionnelle: Modèles Fiables Et Conformes Aux Normes Du Secteur
Pré-Construits Pour Une Utilisation Rapide Et Efficace
Compatible MAC/PC, entièrement débloqué
Aucune Expertise N'Est Requise; Facile À Suivre
Tri Pointe Homes, Inc. (TPH) Bundle
Vous cherchez à évaluer la valeur intrinsèque de Tri Pointe Homes, Inc.? Notre calculatrice (TPH) DCF intègre des données réelles avec des fonctionnalités de personnalisation étendues, vous permettant d'affiner les prévisions et d'améliorer vos stratégies d'investissement.
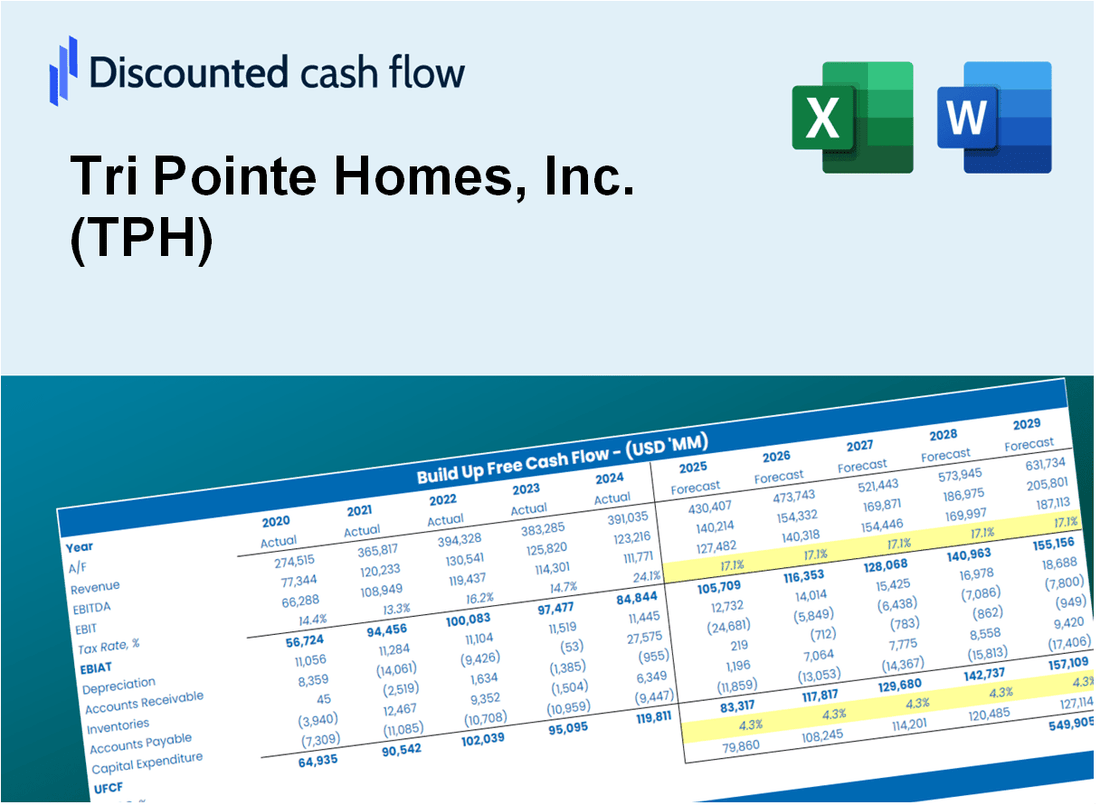
Discounted Cash Flow (DCF) - (USD MM)
| Year | AY1 2020 |
AY2 2021 |
AY3 2022 |
AY4 2023 |
AY5 2024 |
FY1 2025 |
FY2 2026 |
FY3 2027 |
FY4 2028 |
FY5 2029 |
|---|---|---|---|---|---|---|---|---|---|---|
| Revenue | 3,260.4 | 3,982.2 | 4,348.5 | 3,715.2 | 4,422.7 | 4,818.7 | 5,250.1 | 5,720.2 | 6,232.3 | 6,790.4 |
| Revenue Growth, % | 0 | 22.14 | 9.2 | -14.56 | 19.04 | 8.95 | 8.95 | 8.95 | 8.95 | 8.95 |
| EBITDA | 402.9 | 658.1 | 798.6 | 454.9 | 607.9 | 705.8 | 769.0 | 837.8 | 912.8 | 994.6 |
| EBITDA, % | 12.36 | 16.53 | 18.36 | 12.24 | 13.74 | 14.65 | 14.65 | 14.65 | 14.65 | 14.65 |
| Depreciation | 29.5 | 32.4 | 28.0 | 26.9 | 31.0 | 36.5 | 39.8 | 43.3 | 47.2 | 51.4 |
| Depreciation, % | 0.90469 | 0.81414 | 0.64413 | 0.72276 | 0.70134 | 0.75741 | 0.75741 | 0.75741 | 0.75741 | 0.75741 |
| EBIT | 373.4 | 625.7 | 770.5 | 428.0 | 576.9 | 669.3 | 729.2 | 794.5 | 865.6 | 943.1 |
| EBIT, % | 11.45 | 15.71 | 17.72 | 11.52 | 13.04 | 13.89 | 13.89 | 13.89 | 13.89 | 13.89 |
| Total Cash | 621.3 | 681.5 | 889.7 | 869.0 | 970.0 | 982.5 | 1,070.5 | 1,166.4 | 1,270.8 | 1,384.6 |
| Total Cash, percent | .0 | .0 | .0 | .0 | .0 | .0 | .0 | .0 | .0 | .0 |
| Account Receivables | 63.6 | 117.0 | 169.4 | 224.6 | 111.6 | 167.2 | 182.2 | 198.5 | 216.3 | 235.7 |
| Account Receivables, % | 1.95 | 2.94 | 3.9 | 6.05 | 2.52 | 3.47 | 3.47 | 3.47 | 3.47 | 3.47 |
| Inventories | 2,910.1 | 3,054.7 | 3,173.8 | 3,337.5 | 3,153.5 | 3,855.8 | 4,201.0 | 4,577.1 | 4,987.0 | 5,433.5 |
| Inventories, % | 89.26 | 76.71 | 72.99 | 89.83 | 71.3 | 80.02 | 80.02 | 80.02 | 80.02 | 80.02 |
| Accounts Payable | 79.7 | 84.9 | 62.3 | 64.8 | 68.2 | 89.6 | 97.6 | 106.3 | 115.9 | 126.2 |
| Accounts Payable, % | 2.44 | 2.13 | 1.43 | 1.75 | 1.54 | 1.86 | 1.86 | 1.86 | 1.86 | 1.86 |
| Capital Expenditure | -22.8 | -29.5 | -43.6 | -25.4 | -23.3 | -35.2 | -38.4 | -41.8 | -45.5 | -49.6 |
| Capital Expenditure, % | -0.6992 | -0.74051 | -1 | -0.68303 | -0.52679 | -0.73054 | -0.73054 | -0.73054 | -0.73054 | -0.73054 |
| Tax Rate, % | 25.75 | 25.75 | 25.75 | 25.75 | 25.75 | 25.75 | 25.75 | 25.75 | 25.75 | 25.75 |
| EBITAT | 282.2 | 469.3 | 574.1 | 314.8 | 428.3 | 499.1 | 543.8 | 592.5 | 645.6 | 703.4 |
| Depreciation | ||||||||||
| Changes in Account Receivables | ||||||||||
| Changes in Inventories | ||||||||||
| Changes in Accounts Payable | ||||||||||
| Capital Expenditure | ||||||||||
| UFCF | -2,605.1 | 279.3 | 364.4 | 99.9 | 736.5 | -236.2 | 193.0 | 210.3 | 229.2 | 249.7 |
| WACC, % | 8.1 | 8.1 | 8.09 | 8.08 | 8.09 | 8.09 | 8.09 | 8.09 | 8.09 | 8.09 |
| PV UFCF | ||||||||||
| SUM PV UFCF | 450.3 | |||||||||
| Long Term Growth Rate, % | 0.50 | |||||||||
| Free cash flow (T + 1) | 251 | |||||||||
| Terminal Value | 3,304 | |||||||||
| Present Terminal Value | 2,239 | |||||||||
| Enterprise Value | 2,689 | |||||||||
| Net Debt | 130 | |||||||||
| Equity Value | 2,560 | |||||||||
| Diluted Shares Outstanding, MM | 95 | |||||||||
| Equity Value Per Share | 26.97 |
What You Will Get
- Editable Excel Template: A fully customizable Excel-based DCF Calculator featuring pre-filled real TPH financials.
- Real-World Data: Historical data and forward-looking estimates (as indicated in the highlighted cells).
- Forecast Flexibility: Adjust forecast assumptions such as revenue growth, EBITDA %, and WACC.
- Automatic Calculations: Quickly observe the effects of your inputs on Tri Pointe Homes’ valuation.
- Professional Tool: Designed for investors, CFOs, consultants, and financial analysts.
- User-Friendly Design: Organized for clarity and ease of use, complete with step-by-step guidance.
Key Features
- 🔍 Real-Life TPH Financials: Pre-filled historical and projected data for Tri Pointe Homes, Inc. (TPH).
- ✏️ Fully Customizable Inputs: Adjust all critical parameters (yellow cells) like WACC, growth %, and tax rates.
- 📊 Professional DCF Valuation: Built-in formulas calculate Tri Pointe Homes’ intrinsic value using the Discounted Cash Flow method.
- ⚡ Instant Results: Visualize Tri Pointe Homes’ valuation instantly after making changes.
- Scenario Analysis: Test and compare outcomes for various financial assumptions side-by-side.
How It Works
- 1. Access the Template: Download and open the Excel file featuring Tri Pointe Homes, Inc.'s (TPH) preloaded data.
- 2. Adjust Assumptions: Modify essential inputs such as growth rates, WACC, and capital expenditures.
- 3. Instant Results: The DCF model automatically computes intrinsic value and NPV in real-time.
- 4. Explore Scenarios: Evaluate various forecasts to understand different valuation possibilities.
- 5. Present with Assurance: Deliver professional valuation insights to back your strategic decisions.
Why Choose Tri Pointe Homes, Inc. (TPH)?
- Streamlined Process: Skip the hassle of complex calculations – our tools are ready for immediate use.
- Enhanced Precision: Dependable data and methodologies minimize valuation discrepancies.
- Completely Adaptable: Modify the framework to align with your specific forecasts and insights.
- User-Friendly: Intuitive visuals and outputs simplify the analysis of results.
- Endorsed by Professionals: Crafted for industry experts who prioritize accuracy and functionality.
Who Should Use This Product?
- Real Estate Students: Explore housing market trends and apply analytical skills using real data from Tri Pointe Homes, Inc. (TPH).
- Researchers: Utilize industry models in your studies or publications related to residential construction.
- Homebuyers: Evaluate market conditions and make informed decisions when considering properties from Tri Pointe Homes, Inc. (TPH).
- Market Analysts: Enhance your analysis with a customizable model focused on the homebuilding sector.
- Investors: Analyze the performance of Tri Pointe Homes, Inc. (TPH) and compare it with other companies in the real estate market.
What the Template Contains
- Pre-Filled DCF Model: Tri Pointe Homes, Inc.’s (TPH) financial data preloaded for immediate use.
- WACC Calculator: Detailed calculations for Weighted Average Cost of Capital.
- Financial Ratios: Evaluate Tri Pointe Homes, Inc.’s (TPH) profitability, leverage, and efficiency.
- Editable Inputs: Change assumptions such as growth, margins, and CAPEX to fit your scenarios.
- Financial Statements: Annual and quarterly reports to support detailed analysis.
- Interactive Dashboard: Easily visualize key valuation metrics and results.
Disclaimer
All information, articles, and product details provided on this website are for general informational and educational purposes only. We do not claim any ownership over, nor do we intend to infringe upon, any trademarks, copyrights, logos, brand names, or other intellectual property mentioned or depicted on this site. Such intellectual property remains the property of its respective owners, and any references here are made solely for identification or informational purposes, without implying any affiliation, endorsement, or partnership.
We make no representations or warranties, express or implied, regarding the accuracy, completeness, or suitability of any content or products presented. Nothing on this website should be construed as legal, tax, investment, financial, medical, or other professional advice. In addition, no part of this site—including articles or product references—constitutes a solicitation, recommendation, endorsement, advertisement, or offer to buy or sell any securities, franchises, or other financial instruments, particularly in jurisdictions where such activity would be unlawful.
All content is of a general nature and may not address the specific circumstances of any individual or entity. It is not a substitute for professional advice or services. Any actions you take based on the information provided here are strictly at your own risk. You accept full responsibility for any decisions or outcomes arising from your use of this website and agree to release us from any liability in connection with your use of, or reliance upon, the content or products found herein.