
|
Trigano S.A. (Tri.Pa) Valation DCF |
Entièrement Modifiable: Adapté À Vos Besoins Dans Excel Ou Sheets
Conception Professionnelle: Modèles Fiables Et Conformes Aux Normes Du Secteur
Pré-Construits Pour Une Utilisation Rapide Et Efficace
Compatible MAC/PC, entièrement débloqué
Aucune Expertise N'Est Requise; Facile À Suivre
Trigano S.A. (TRI.PA) Bundle
Que vous soyez un investisseur ou un analyste, cette calculatrice DCF Trigano S.A. (TripA) est votre ressource incontournable pour une évaluation précise. Préchargé avec des données réelles de Trigano S.A., vous pouvez facilement ajuster les prévisions et observer les effets en temps réel.
Your Benefits
- Accurate TRIPA Financial Data: Pre-loaded with Trigano S.A.'s historical and forecasted figures for detailed analysis.
- Completely Customizable Template: Effortlessly adjust vital inputs such as revenue growth, WACC, and EBITDA percentage.
- Instant Calculations: Watch as Trigano's intrinsic value recalibrates immediately with your adjustments.
- Professional Valuation Tool: Tailored for investors, analysts, and consultants in search of reliable DCF outcomes.
- User-Friendly Interface: Intuitive layout and straightforward instructions suitable for all skill levels.
Key Features
- 🔍 Real-Life TRIPA Financials: Pre-filled historical and projected data for Trigano S.A.
- ✏️ Fully Customizable Inputs: Modify essential parameters (yellow cells) such as WACC, growth %, and tax rates as needed.
- 📊 Professional DCF Valuation: Integrated formulas assess Trigano's intrinsic value using the Discounted Cash Flow method.
- ⚡ Instant Results: Immediately visualize Trigano's valuation upon making adjustments.
- Scenario Analysis: Evaluate and compare outcomes for different financial assumptions side-by-side.
How It Works
- Download: Obtain the pre-formatted Excel file containing Trigano S.A.'s (TRIPA) financial data.
- Customize: Modify projections such as revenue growth, EBITDA margin, and WACC.
- Update Automatically: The intrinsic value and NPV calculations refresh in real-time.
- Test Scenarios: Develop various forecasts and compare the results immediately.
- Make Decisions: Leverage the valuation insights to inform your investment strategy.
Why Choose Trigano's Financial Calculator?
- Save Time: Skip the hassle of building a DCF model from the ground up – it's ready for immediate use.
- Enhance Accuracy: Dependable financial data and formulas minimize valuation errors.
- Completely Customizable: Adjust the model to align with your unique assumptions and forecasts.
- User-Friendly: Intuitive charts and outputs make analyzing results straightforward.
- Endorsed by Professionals: Crafted for experts who prioritize precision and user experience.
Who Can Benefit from This Product?
- Institutional Investors: Create comprehensive and dependable valuation models for analyzing investments in Trigano S.A. (TRIPA).
- Corporate Finance Professionals: Evaluate different valuation scenarios to inform strategic decisions within their organizations.
- Financial Consultants and Advisors: Deliver precise valuation insights to clients interested in Trigano S.A. (TRIPA) stocks.
- Academics and Students: Utilize real-time data to enhance learning and practice in financial modeling.
- Industry Enthusiasts: Gain insights into how companies like Trigano S.A. (TRIPA) are appraised in the market.
Contents of the Template
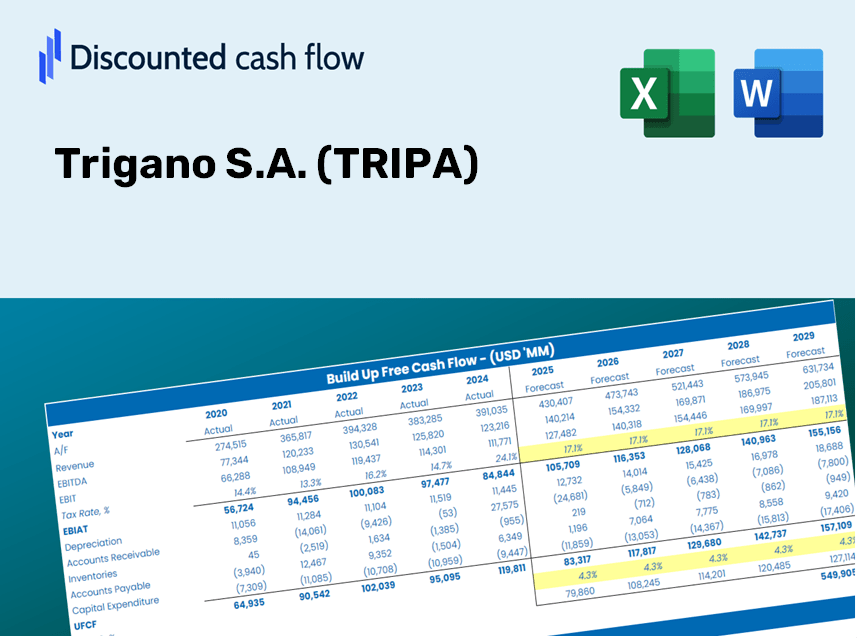
- Operating and Balance Sheet Data: Pre-filled historical data and projections for Trigano S.A. (TRIPA), including revenue, EBITDA, EBIT, and capital expenditures.
- WACC Calculation: A separate sheet dedicated to the Weighted Average Cost of Capital (WACC), outlining key parameters such as Beta, risk-free rate, and share price.
- DCF Valuation (Unlevered and Levered): Customizable Discounted Cash Flow models that illustrate intrinsic value with comprehensive calculations.
- Financial Statements: Pre-loaded annual and quarterly financial statements to facilitate thorough analysis.
- Key Ratios: Includes critical profitability, leverage, and efficiency ratios for Trigano S.A. (TRIPA).
- Dashboard and Charts: A visual representation of valuation outputs and assumptions for straightforward result analysis.
Disclaimer
All information, articles, and product details provided on this website are for general informational and educational purposes only. We do not claim any ownership over, nor do we intend to infringe upon, any trademarks, copyrights, logos, brand names, or other intellectual property mentioned or depicted on this site. Such intellectual property remains the property of its respective owners, and any references here are made solely for identification or informational purposes, without implying any affiliation, endorsement, or partnership.
We make no representations or warranties, express or implied, regarding the accuracy, completeness, or suitability of any content or products presented. Nothing on this website should be construed as legal, tax, investment, financial, medical, or other professional advice. In addition, no part of this site—including articles or product references—constitutes a solicitation, recommendation, endorsement, advertisement, or offer to buy or sell any securities, franchises, or other financial instruments, particularly in jurisdictions where such activity would be unlawful.
All content is of a general nature and may not address the specific circumstances of any individual or entity. It is not a substitute for professional advice or services. Any actions you take based on the information provided here are strictly at your own risk. You accept full responsibility for any decisions or outcomes arising from your use of this website and agree to release us from any liability in connection with your use of, or reliance upon, the content or products found herein.