
|
TPG RE Finance Trust, Inc. (TRTX): 5 Forces Analysis [Jan-2025 Mis à jour] |
Entièrement Modifiable: Adapté À Vos Besoins Dans Excel Ou Sheets
Conception Professionnelle: Modèles Fiables Et Conformes Aux Normes Du Secteur
Pré-Construits Pour Une Utilisation Rapide Et Efficace
Compatible MAC/PC, entièrement débloqué
Aucune Expertise N'Est Requise; Facile À Suivre
TPG RE Finance Trust, Inc. (TRTX) Bundle
Plongez dans le monde complexe de TPG Re Finance Trust, Inc. (TRTX), où l'équilibre délicat des forces du marché façonne son paysage stratégique en 2024. Cette analyse de plongée profonde dévoile la dynamique critique du pouvoir des fournisseurs, des négociations clients, des pressions compétitives, Des substituts potentiels et des obstacles à l'entrée définissent l'écosystème de prêt immobilier commercial. Découvrez comment TRTX navigue sur le terrain complexe des marchés financiers, en tirant parti de son positionnement unique pour maintenir un avantage concurrentiel dans un environnement de prêt de plus en plus difficile et innovant.
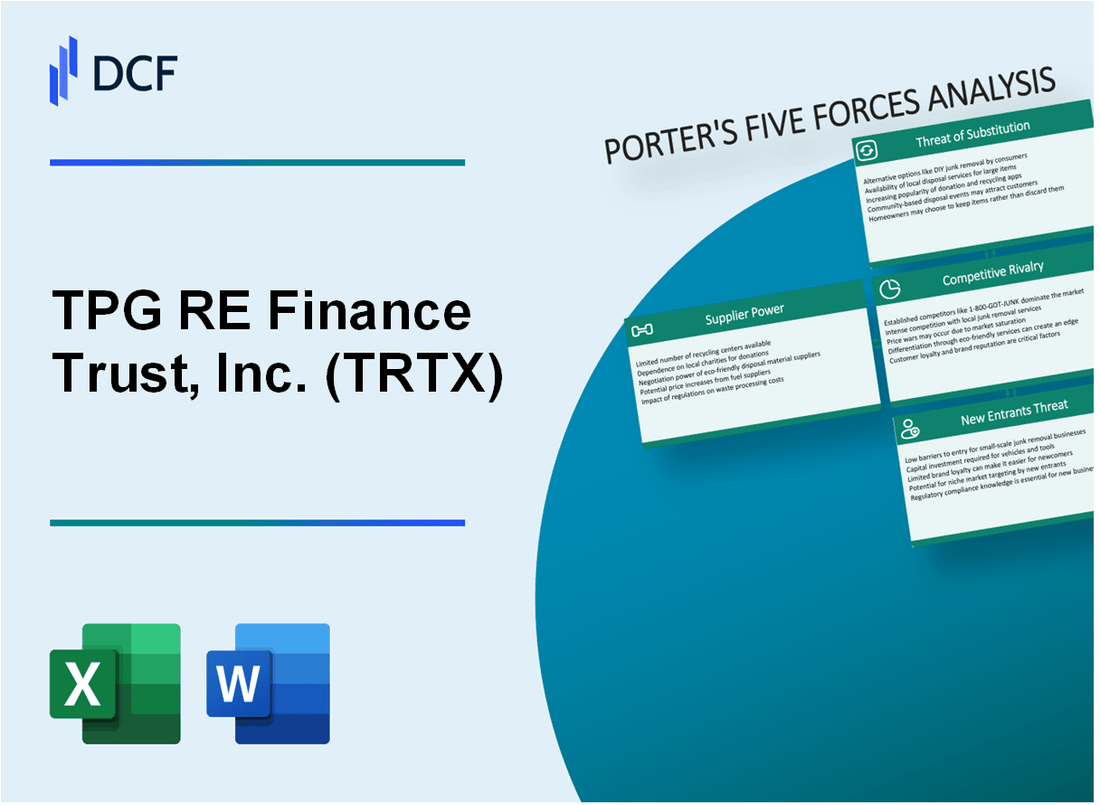
TPG RE Finance Trust, Inc. (TRTX) - Five Forces de Porter: Pouvoir de négociation des fournisseurs
Nombre limité de fournisseurs de prêts immobiliers commerciaux spécialisés
En 2024, TPG Re Finance Trust fonctionne sur un marché concentré avec environ 15-20 fournisseurs de prêts immobiliers commerciaux spécialisés. La taille totale du marché pour les prêts immobiliers commerciaux est estimé à 1,7 billion de dollars.
| Catégorie des fournisseurs | Part de marché | Volume de prêt annuel |
|---|---|---|
| Grandes banques | 42% | 714 milliards de dollars |
| FPI spécialisés | 28% | 476 milliards de dollars |
| Entreprises de prêt privées | 18% | 306 milliards de dollars |
| Prêteurs alternatifs | 12% | 204 milliards de dollars |
Accès aux marchés des capitaux et aux sources de financement
La structure du capital de TRTX comprend:
- Facilités de crédit garanties: 500 millions de dollars
- Dette non garantie: 350 millions de dollars
- Capital de capitaux propres: 1,2 milliard de dollars
Relations avec les grandes banques et les institutions financières
Partenariats financiers clés à partir de 2024:
| Institution financière | Ligne de crédit | Taux d'intérêt |
|---|---|---|
| JPMorgan Chase | 250 millions de dollars | Libor + 2,5% |
| Wells Fargo | 180 millions de dollars | Libor + 2,75% |
| Banque d'Amérique | 150 millions de dollars | Libor + 3% |
Crédit la qualité et levier de négociation
Métriques financières de TRTX:
- Note de crédit: BBB
- Ratio dette / fonds propres: 1,8: 1
- Marge d'intérêt net: 3,2%
- Qualité moyenne du portefeuille de prêts: 92% de prêts
TPG RE Finance Trust, Inc. (TRTX) - Five Forces de Porter: Pouvoir de négociation des clients
Clients diversifiés dans des prêts immobiliers commerciaux
Au quatrième trimestre 2023, TPG Re Finance Trust, Inc. a servi environ 87 emprunteurs immobiliers commerciaux différents dans divers secteurs de propriété. Le portefeuille total des prêts était évalué à 3,2 milliards de dollars, avec une taille de prêt moyenne de 36,8 millions de dollars.
| Segment de clientèle | Volume de prêt | Pourcentage de portefeuille |
|---|---|---|
| Multifamilial | 1,45 milliard de dollars | 45.3% |
| Bureau | 680 millions de dollars | 21.3% |
| Hospitalité | 420 millions de dollars | 13.1% |
| Industriel | 380 millions de dollars | 11.9% |
| Vente au détail | 265 millions de dollars | 8.4% |
Caractéristiques de l'emprunteur et dynamique du marché
La clientèle de l'entreprise démontre une sophistication importante avec les éléments suivants profile:
- Valeur nette moyenne de l'emprunteur: 78,5 millions de dollars
- Expérience d'investissement immobilier typique de l'emprunteur: 12,3 ans
- Taille de la transaction médiane: 25 à 50 millions de dollars
Taux d'intérêt et sensibilité à la durée du prêt
En 2023, TPG RE Finance Trust a observé les comportements des clients suivants:
- Fréquence de négociation des taux d'intérêt: 62% des emprunteurs ont demandé des ajustements de taux
- Taux d'intérêt moyen pour les prêts: 6,75%
- Plage du terme de prêt: 3-7 ans
- Demandes de refinancement: 41 transactions en 2023
Influences sur les conditions du marché
| Indicateur de marché | Valeur 2023 | Impact sur la négociation des clients |
|---|---|---|
| Taux de plafond immobilier commercial | 5.8% - 7.2% | Sensibilité élevée aux prix |
| Taux de fonds fédéraux | 5.25% - 5.50% | Augmentation des coûts d'emprunt |
| Ratio de prêt / valeur | 60% - 70% | Normes de prêt conservatrices |
TPG RE Finance Trust, Inc. (TRTX) - Five Forces de Porter: rivalité compétitive
Paysage concurrentiel du marché
Depuis le quatrième trimestre 2023, TPG Re Finance Trust, Inc. fait face à la concurrence de 37 sociétés de financement immobilier commercial directes aux États-Unis.
| Catégorie des concurrents | Nombre de concurrents | Gamme de parts de marché |
|---|---|---|
| Banques traditionnelles | 12 | 35-40% |
| Plateformes de prêt alternatives | 15 | 25-30% |
| Spécialistes des finances du REIT | 10 | 15-20% |
Dynamique compétitive
TRTX est en concurrence sur un marché avec les caractéristiques financières suivantes:
- Volume moyen de création de prêt: 2,3 milliards de dollars par an
- Taux d'intérêt médian: 6,75% à 8,25%
- Taille moyenne du prêt: 45,6 millions de dollars
Comparaison de stratégie de prêt
| Métrique | Performance trtx | Moyenne de l'industrie |
|---|---|---|
| Taux d'approbation du prêt | 68% | 62% |
| Terme de prêt moyen | 5,2 ans | 4,8 ans |
| Rendement ajusté au risque | 12.4% | 11.7% |
Pressions concurrentielles
Les mesures concurrentielles clés indiquent des défis importants du marché:
- Marge d'intérêt net: 2,85%
- Coût du capital: 4,6%
- Retour des capitaux propres: 10,2%
TPG RE Finance Trust, Inc. (TRTX) - Five Forces de Porter: Menace de substituts
Options de financement alternatives
Au quatrième trimestre 2023, le volume du marché des titres adossés à des créances hypothécaires (CMBS) a atteint 77,3 milliards de dollars. Les prêts bancaires pour l'immobilier commercial ont totalisé 2,47 billions de dollars de soldes en cours. Le volume d'investissement immobilier en capital-investissement était de 179 milliards de dollars en 2023.
| Option de financement | Volume total du marché 2023 | Taux d'intérêt moyen |
|---|---|---|
| Cmbs | 77,3 milliards de dollars | 6.25% |
| Prêts bancaires | 2,47 billions de dollars | 7.5% |
| Capital-investissement | 179 milliards de dollars | 8.3% |
Plates-formes de prêt fintech
En 2023, les plateformes de prêt fintech ont créé 24,6 milliards de dollars de prêts immobiliers commerciaux, ce qui représente une croissance de 22% sur l'autre.
- Part de marché des plates-formes de prêt numérique: 4,7%
- Taille moyenne du prêt: 3,2 millions de dollars
- Temps de traitement des prêts typique: 7-14 jours
Plateformes d'investissement immobilier de financement participatif
Les plateformes de financement participatif immobilier ont levé 3,8 milliards de dollars en 2023, avec un rendement d'investissement moyen de 10,6%.
| Type de plate-forme | Capital total levé | Rendement moyen des investisseurs |
|---|---|---|
| Financement participatif | 2,4 milliards de dollars | 11.2% |
| Financement participatif de la dette | 1,4 milliard de dollars | 9.3% |
Complexité commerciale de financement immobilier
Le paysage du financement immobilier commercial montre une diversification croissante, avec 37 types de produits de financement différents disponibles en 2023.
- Nombre de produits de financement alternatifs: 37
- Variation des conditions de prêt moyen: 24 à 60 mois
- Canaux de financement émergents: 6 nouvelles plateformes en 2023
TPG RE Finance Trust, Inc. (TRTX) - Five Forces de Porter: Menace de nouveaux entrants
Exigences de capital élevé pour les prêts immobiliers commerciaux
TPG Re Finance Trust, Inc. nécessite un investissement en capital substantiel pour l'entrée sur le marché. Au troisième trimestre 2023, les actifs totaux de la société étaient de 3,27 milliards de dollars, avec un portefeuille de prêts de 2,98 milliards de dollars.
| Métrique capitale | Montant |
|---|---|
| Exigence de capital minimum | 50 millions à 100 millions de dollars |
| Investissement initial moyen | 75 millions de dollars |
| Ratio de capital réglementaire | 15.2% |
Obstacles à la conformité réglementaire à l'entrée du marché
Les exigences réglementaires créent des défis d'entrée sur le marché importants.
- Coûts de conformité de la loi Dodd-Frank: 500 000 $ - 2 millions de dollars par an
- Frais d'enregistrement de la SEC: 150 000 $ d'inscription initiale
- Coûts d'audit de la conformité annuels: 250 000 $ - 750 000 $
Connaissances et expertise spécialisées
Le financement commercial de l'immobilier exige une expertise avancée.
| Exigence d'expertise | Niveau de complexité |
|---|---|
| Modélisation financière avancée | Haut |
| Compétences d'évaluation des risques | Critique |
| Compétence d'analyse du marché | Essentiel |
Relations et antécédents établis
TPG RE Finance Trust démontre le positionnement critique du marché.
- Originations totales de prêt en 2023: 1,2 milliard de dollars
- Taille moyenne du prêt: 25 millions de dollars
- Base de clientèle existante: 87 investisseurs institutionnels
TPG RE Finance Trust, Inc. (TRTX) - Porter's Five Forces: Competitive rivalry
The competitive rivalry within the commercial real estate finance space remains intense for TPG RE Finance Trust, Inc. (TRTX). You are competing directly against established mREIT peers, large commercial banks with deep capital bases, and increasingly aggressive private debt funds for the best quality first mortgage loans.
TPG RE Finance Trust, Inc. (TRTX) demonstrated this competitive drive in the second quarter of 2025, achieving a 15% net earning loan portfolio growth. This growth was fueled by closing seven new first mortgage loans with aggregate total commitments of $695.6 million.
Competition forces TPG RE Finance Trust, Inc. (TRTX) to focus on execution speed and the attractiveness of the loan terms. For the new originations in Q2 2025, the weighted average credit spread achieved was Term SOFR plus 2.86%, with a weighted average interest rate floor of 3.12%. This pricing is a direct reflection of the market dynamics where TPG RE Finance Trust, Inc. (TRTX) must compete.
The pressure is evident in the sector-specific challenges, particularly in office assets. TPG RE Finance Trust, Inc. (TRTX) received loan repayments of $21.5 million related to two office loans in the first quarter of 2025. Furthermore, the company actively managed its exposure by selling two REO office properties in Q2 2025 for $39.4 million, which reduced office REO exposure to approximately 1% of the balance sheet and overall REO to about 5% of total assets.
The need to deploy capital aggressively, evidenced by the 15% portfolio growth, suggests competition for origination volume is high, especially as transaction activity in certain areas slows. TPG RE Finance Trust, Inc. (TRTX) supported this deployment with $236.4 million of available liquidity as of the end of Q2 2025, while maintaining a debt-to-equity ratio of approximately 2.6x.
Here is a look at the Q2 2025 origination and balance sheet metrics that reflect the competitive environment:
| Metric | Value | Context |
|---|---|---|
| Net Earning Loan Growth (Q2 2025) | 15% | Indicates aggressive pursuit of origination volume. |
| New Loan Commitments Originated (Q2 2025) | $695.6 million | Total volume deployed against competitors. |
| Weighted Average Credit Spread (New Loans Q2 2025) | Term SOFR + 2.86% | Pricing competition point. |
| Weighted Average Interest Rate Floor (Q2 2025) | 3.12% | Component of loan structure competition. |
| Available Liquidity (End of Q2 2025) | $236.4 million | Dry powder for rapid execution. |
| Debt-to-Equity Ratio (End of Q2 2025) | ~2.6x | Leverage position relative to peers. |
| Book Value Per Common Share (June 30, 2025) | $11.20 | Benchmark for valuation and pricing. |
TPG RE Finance Trust, Inc. (TRTX) is also actively managing its capital structure to remain competitive on cost and execution speed. The company repurchased $12.5 million of common stock in Q2 2025, which provided $0.08 per share of net book value accretion. The focus on a stable liability structure and significant liquidity helps TPG RE Finance Trust, Inc. (TRTX) offer speed of execution when competitors might be constrained.
The competitive pressures manifest in several ways that TPG RE Finance Trust, Inc. (TRTX) must manage:
- Competition on pricing, seen in the weighted average credit spread of new loans.
- Competition on speed of execution, supported by $236.4 million in liquidity.
- Sector-specific stress, highlighted by office loan repayments in Q1 2025.
- The need to deploy capital to achieve 15% loan growth against market headwinds.
For context on prior quarter activity, TPG RE Finance Trust, Inc. (TRTX) committed $242 million of new loans in Q4 2024 at a spread of SOFR+3.25%.
TPG RE Finance Trust, Inc. (TRTX) - Porter's Five Forces: Threat of substitutes
Traditional bank lending remains a primary substitute for TPG RE Finance Trust, Inc. (TRTX)'s bridge and transitional loans. While banks are still active, especially for stabilized assets, their pricing in late 2025 reflects a selective approach. For instance, as of the fourth quarter of 2025 in the Southwest and Midwest, commercial loan rates from banks for multifamily and mixed-use properties ranged between 5.8% and 6.2% across those regions. You'll notice this is generally tighter than the bridge loan market, which saw indicative non-recourse pricing between 9.0% and 12.0% in Texas during the same period.
Life insurance companies and pension funds offer long-term, fixed-rate financing, a key substitute for permanent debt that TPG RE Finance Trust, Inc. (TRTX) competes against for longer-duration capital needs. These lenders often target core assets where stability is paramount. For stabilized core assets as of Q4 2025, life companies were quoting rates between 5.5% and 6.1%. Still, this capital source is typically less agile for the transitional or bridge needs that TPG RE Finance Trust, Inc. (TRTX) specializes in.
The Commercial Mortgage-Backed Securities (CMBS) market provides an alternative source of financing for commercial real estate (CRE) sponsors, and it is experiencing a significant resurgence. The momentum from 2024 has carried into 2025, making it a very competitive substitute. TPG RE Finance Trust, Inc. (TRTX) itself utilizes securitization, having recently closed its TRTX 2025-FL7 CLO, which moved approximately 30.2% of its loan investment portfolio, or about $1,100 million in aggregate principal balance, into a securitized structure as of October 2025.
Private equity real estate debt funds are direct and growing substitutes, often with more flexible capital, though their fundraising pace has moderated recently. While TPG RE Finance Trust, Inc. (TRTX) operates in a similar non-bank space, these dedicated debt funds compete for the same deal flow. For context on the scale of this substitute market, real estate debt-focused funds raised $22.5 billion in 2024, with an average fund size of $264.5 million that year.
Here's a quick look at how the major debt substitutes are performing in 2025:
| Financing Substitute | Key 2025 Metric | Associated Rate/Volume |
|---|---|---|
| CMBS (Total Issuance YTD) | Year-to-Date Volume (Q3 2025) | $90.85 billion |
| CMBS (SASB Deals YTD) | Volume from Single-Asset, Single-Borrower | $67.47 billion |
| Bank Lending (Multifamily/Mixed-Use) | Indicative Rate (Q4 2025, Texas/KC) | 5.8% to 6.2% |
| Life Companies (Stabilized Core) | Indicative Rate (Q4 2025) | 5.5% to 6.1% |
| Bridge Loans (Non-Recourse) | Indicative Pricing (Q4 2025, Texas) | 9.0% to 12.0% |
The competitive landscape is defined by the accessibility and pricing of these alternatives. You should keep an eye on the following factors that influence the threat level:
- CMBS issuance is on pace to exceed $121 billion in 2025, the highest since 2007.
- The dollar volume of CMBS loans increased by 37% year-over-year in Q1 2025.
- Life insurance company originations saw a 61% increase in loan volume in Q1 2025 compared to the prior year.
- TPG RE Finance Trust, Inc. (TRTX) originated $279.2 million in total loan commitments in Q3 2025, showing direct competition in the origination space.
- The average size of a real estate debt-focused fund in 2024 was $264.5 million.
The sheer volume of capital flowing through the CMBS channel, with YTD issuance already at $90.85 billion through Q3 2025, represents a substantial, readily available alternative for sponsors seeking execution on large deals. Also, the fact that TPG RE Finance Trust, Inc. (TRTX) securitized 30.2% of its portfolio into a $1,100 million CLO shows that securitization is both a funding tool for them and a direct market substitute for borrowers.
TPG RE Finance Trust, Inc. (TRTX) - Porter's Five Forces: Threat of new entrants
Capital requirements present a significant barrier to entry. Competing with TPG RE Finance Trust, Inc.'s scale means new entrants need access to billions in committed capital. TPG RE Finance Trust, Inc. recently closed TRTX 2025-FL7, a managed Commercial Real Estate Collateralized Loan Obligation (CRE CLO) totaling \$1.1 billion. This scale of financing is not easily replicated by a startup. To put the parent platform's scale in context, TPG Real Estate itself manages \$19B in Assets Under Management (AUM), part of the larger TPG firm managing \$286 billion in AUM as of September 30, 2025.
Regulatory hurdles and the complexity of maintaining Real Estate Investment Trust (REIT) status deter many smaller players. TPG RE Finance Trust, Inc. explicitly notes the risk associated with its ability to maintain qualification as a REIT for U.S. federal income tax purposes. Navigating the Investment Company Act of 1940 exemptions, alongside standard corporate governance, requires specialized, costly infrastructure that a new entrant would need to build from scratch.
The need for an established, integrated platform like TPG Real Estate's for sourcing and underwriting deals is a major barrier. TPG RE Finance Trust, Inc. maintains a robust pipeline, evidenced by originating \$279.2 million of total loan commitments in the third quarter of 2025. This requires deep, proprietary deal flow, which is a function of years of relationship building within the TPG ecosystem. Furthermore, TPG RE Finance Trust, Inc. has established financing relationships, such as an extended secured revolving credit facility with increased capacity to \$375.0 million.
New entrants would struggle to immediately issue large, non-recourse CRE CLOs like TPG RE Finance Trust, Inc.'s recent transaction. The TRTX 2025-FL7 issuance placed approximately \$957.0 million of investment-grade securities with institutional investors on a non-recourse basis. This ability to structure and place such large tranches relies on deep relationships with the structuring agents and bookrunners, such as Goldman Sachs Co. LLC, which acted as the sole structuring agent for the 2025-FL7 deal.
Here's a quick look at the scale of TPG RE Finance Trust, Inc.'s recent financing activity:
| Metric | Value | Date/Context |
|---|---|---|
| TRTX 2025-FL7 Total CLO Size | \$1.1 billion | Closed late 2025 |
| TRTX 2025-FL7 Investment Grade Securities Placed | \$957.0 million | TRTX 2025-FL7 |
| TRTX 2021-FL4 Outstanding Securities Redeemed | \$411.5 million | In connection with 2025-FL7 |
| TRTX 2025-FL6 Advance Rate | 87.5% | TRTX 2025-FL6 |
| TRTX 2025-FL7 Advance Rate | 87.0% | TRTX 2025-FL7 |
| TRTX 2025-FL7 Wtd. Avg. Interest Rate | Term SOFR plus 1.67% | At issuance |
| Q3 2025 Loan Commitments Originated | \$279.2 million | Third Quarter 2025 |
| Book Value per Common Share | \$11.25 | As of September 30, 2025 |
The operational requirements for a new entrant to match TPG RE Finance Trust, Inc.'s structure include:
- Securing relationships with major investment banks for structuring.
- Building a track record to place nearly \$1 billion in securities.
- Maintaining sufficient equity base, with Total Stockholders' Equity including \$201.3 million in preferred equity as of March 31, 2025.
- Managing a portfolio with a weighted average risk rating of 3.0 as of March 31, 2025.
- Establishing a liability structure that allows for non-mark-to-market, non-recourse financing.
The sheer size of the capital markets access needed acts as a moat. For instance, the net cash proceeds from the TRTX 2025-FL7 issuance and TRTX 2021-FL4 redemption are expected to be approximately \$58.5 million for investment and corporate purposes. This level of capital recycling and deployment is a function of an existing, scaled operation.
Disclaimer
All information, articles, and product details provided on this website are for general informational and educational purposes only. We do not claim any ownership over, nor do we intend to infringe upon, any trademarks, copyrights, logos, brand names, or other intellectual property mentioned or depicted on this site. Such intellectual property remains the property of its respective owners, and any references here are made solely for identification or informational purposes, without implying any affiliation, endorsement, or partnership.
We make no representations or warranties, express or implied, regarding the accuracy, completeness, or suitability of any content or products presented. Nothing on this website should be construed as legal, tax, investment, financial, medical, or other professional advice. In addition, no part of this site—including articles or product references—constitutes a solicitation, recommendation, endorsement, advertisement, or offer to buy or sell any securities, franchises, or other financial instruments, particularly in jurisdictions where such activity would be unlawful.
All content is of a general nature and may not address the specific circumstances of any individual or entity. It is not a substitute for professional advice or services. Any actions you take based on the information provided here are strictly at your own risk. You accept full responsibility for any decisions or outcomes arising from your use of this website and agree to release us from any liability in connection with your use of, or reliance upon, the content or products found herein.