
|
TTEC Holdings, Inc. (TTEC) Valation DCF |
Entièrement Modifiable: Adapté À Vos Besoins Dans Excel Ou Sheets
Conception Professionnelle: Modèles Fiables Et Conformes Aux Normes Du Secteur
Pré-Construits Pour Une Utilisation Rapide Et Efficace
Compatible MAC/PC, entièrement débloqué
Aucune Expertise N'Est Requise; Facile À Suivre
TTEC Holdings, Inc. (TTEC) Bundle
Explorez TTEC Holdings, Inc. (TTEC) Fuillon financier avec notre calculatrice DCF conviviale! Entrez vos hypothèses de croissance, de marges et de coûts pour déterminer la valeur intrinsèque de TTEC et informer votre stratégie d'investissement.
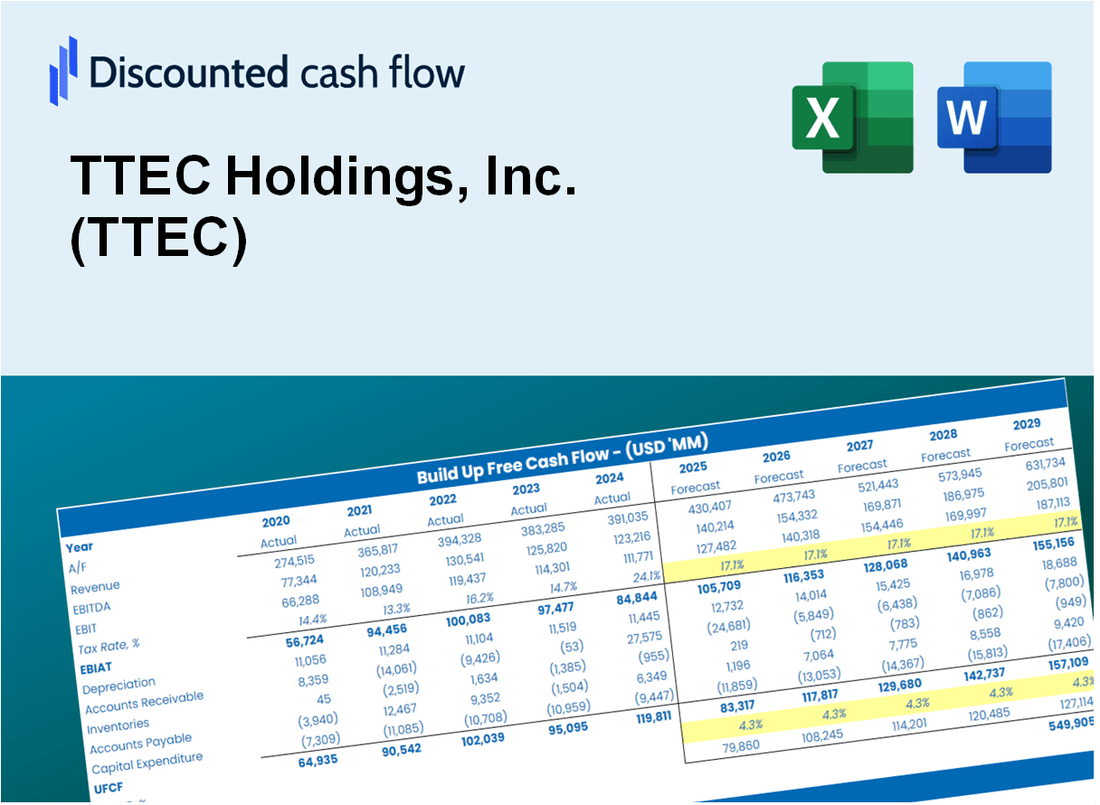
Discounted Cash Flow (DCF) - (USD MM)
| Year | AY1 2020 |
AY2 2021 |
AY3 2022 |
AY4 2023 |
AY5 2024 |
FY1 2025 |
FY2 2026 |
FY3 2027 |
FY4 2028 |
FY5 2029 |
|---|---|---|---|---|---|---|---|---|---|---|
| Revenue | 1,949.2 | 2,273.1 | 2,443.7 | 2,462.8 | 2,207.6 | 2,296.3 | 2,388.7 | 2,484.7 | 2,584.6 | 2,688.5 |
| Revenue Growth, % | 0 | 16.61 | 7.51 | 0.78201 | -10.36 | 4.02 | 4.02 | 4.02 | 4.02 | 4.02 |
| EBITDA | 266.6 | 317.0 | 301.2 | 220.3 | -54.2 | 213.3 | 221.8 | 230.8 | 240.0 | 249.7 |
| EBITDA, % | 13.68 | 13.94 | 12.33 | 8.95 | -2.46 | 9.29 | 9.29 | 9.29 | 9.29 | 9.29 |
| Depreciation | 78.9 | 96.7 | 111.8 | 101.3 | 98.0 | 98.4 | 102.4 | 106.5 | 110.7 | 115.2 |
| Depreciation, % | 4.05 | 4.25 | 4.57 | 4.11 | 4.44 | 4.28 | 4.28 | 4.28 | 4.28 | 4.28 |
| EBIT | 187.8 | 220.3 | 189.4 | 119.0 | -152.2 | 114.9 | 119.5 | 124.3 | 129.3 | 134.5 |
| EBIT, % | 9.63 | 9.69 | 7.75 | 4.83 | -6.89 | 5 | 5 | 5 | 5 | 5 |
| Total Cash | 132.9 | 158.2 | 153.4 | 172.7 | 85.0 | 142.0 | 147.7 | 153.7 | 159.8 | 166.3 |
| Total Cash, percent | .0 | .0 | .0 | .0 | .0 | .0 | .0 | .0 | .0 | .0 |
| Account Receivables | 419.3 | 405.4 | 463.2 | 413.4 | 474.4 | 443.5 | 461.4 | 479.9 | 499.2 | 519.3 |
| Account Receivables, % | 21.51 | 17.84 | 18.95 | 16.79 | 21.49 | 19.31 | 19.31 | 19.31 | 19.31 | 19.31 |
| Inventories | .0 | .0 | .0 | .0 | .0 | .0 | .0 | .0 | .0 | .0 |
| Inventories, % | 0 | 0 | 0 | 0 | 0 | 0 | 0 | 0 | 0 | 0 |
| Accounts Payable | 66.7 | 70.4 | 93.9 | 96.6 | 84.2 | 83.1 | 86.5 | 89.9 | 93.5 | 97.3 |
| Accounts Payable, % | 3.42 | 3.1 | 3.84 | 3.92 | 3.81 | 3.62 | 3.62 | 3.62 | 3.62 | 3.62 |
| Capital Expenditure | -59.8 | -60.4 | -84.0 | -67.8 | -45.2 | -64.1 | -66.7 | -69.4 | -72.2 | -75.1 |
| Capital Expenditure, % | -3.07 | -2.66 | -3.44 | -2.75 | -2.05 | -2.79 | -2.79 | -2.79 | -2.79 | -2.79 |
| Tax Rate, % | -35.7 | -35.7 | -35.7 | -35.7 | -35.7 | -35.7 | -35.7 | -35.7 | -35.7 | -35.7 |
| EBITAT | 130.8 | 149.4 | 135.4 | 24.6 | -206.5 | 75.7 | 78.8 | 82.0 | 85.2 | 88.7 |
| Depreciation | ||||||||||
| Changes in Account Receivables | ||||||||||
| Changes in Inventories | ||||||||||
| Changes in Accounts Payable | ||||||||||
| Capital Expenditure | ||||||||||
| UFCF | -202.7 | 203.3 | 129.0 | 110.5 | -227.1 | 139.8 | 100.0 | 104.0 | 108.2 | 112.5 |
| WACC, % | 5.82 | 5.69 | 5.95 | 2.42 | 7.93 | 5.56 | 5.56 | 5.56 | 5.56 | 5.56 |
| PV UFCF | ||||||||||
| SUM PV UFCF | 483.4 | |||||||||
| Long Term Growth Rate, % | 2.00 | |||||||||
| Free cash flow (T + 1) | 115 | |||||||||
| Terminal Value | 3,221 | |||||||||
| Present Terminal Value | 2,457 | |||||||||
| Enterprise Value | 2,940 | |||||||||
| Net Debt | 994 | |||||||||
| Equity Value | 1,946 | |||||||||
| Diluted Shares Outstanding, MM | 48 | |||||||||
| Equity Value Per Share | 40.87 |
What You Will Get
- Real TTEC Financial Data: Pre-filled with TTEC Holdings, Inc.'s historical and projected data for precise analysis.
- Fully Editable Template: Modify key inputs like revenue growth, WACC, and EBITDA % with ease.
- Automatic Calculations: Watch TTEC's intrinsic value update instantly based on your changes.
- Professional Valuation Tool: Designed for investors, analysts, and consultants seeking accurate DCF results.
- User-Friendly Design: Simple structure and clear instructions for all experience levels.
Key Features
- Pre-Loaded Data: TTEC Holdings, Inc.'s historical financial statements and pre-filled forecasts.
- Fully Adjustable Inputs: Modify WACC, tax rates, revenue growth, and EBITDA margins as needed.
- Instant Results: Observe TTEC's intrinsic value recalculating in real time.
- Clear Visual Outputs: Dashboard charts present valuation results and essential metrics.
- Built for Accuracy: A professional tool designed for analysts, investors, and finance professionals.
How It Works
- Step 1: Download the Excel file.
- Step 2: Review pre-entered TTEC data (historical and projected).
- Step 3: Adjust key assumptions (yellow cells) based on your analysis.
- Step 4: View automatic recalculations for TTEC’s intrinsic value.
- Step 5: Use the outputs for investment decisions or reporting.
Why Choose TTEC Holdings, Inc. (TTEC) Calculator?
- Accuracy: Utilizes real TTEC financial data to ensure precise calculations.
- Flexibility: Allows users to easily adjust and experiment with various inputs.
- Time-Saving: Eliminate the need to create a DCF model from the ground up.
- Professional-Grade: Crafted with the expertise and usability expected at the CFO level.
- User-Friendly: Intuitive interface suitable for users without extensive financial modeling skills.
Who Should Use TTEC Holdings, Inc. (TTEC)?
- Investors: Gain insights and make informed decisions with TTEC's comprehensive service offerings.
- Business Analysts: Streamline your analysis with TTEC's innovative solutions tailored for industry needs.
- Consultants: Effortlessly customize TTEC's resources for impactful client presentations and strategic reports.
- Industry Enthusiasts: Enhance your knowledge of customer experience trends through TTEC's real-world applications.
- Educators and Students: Utilize TTEC's insights as a practical resource in business and management courses.
What the Template Contains
- Comprehensive DCF Model: Editable template with detailed valuation calculations tailored for TTEC Holdings, Inc. (TTEC).
- Real-World Data: TTEC’s historical and projected financials preloaded for thorough analysis.
- Customizable Parameters: Adjust WACC, growth rates, and tax assumptions to explore various scenarios.
- Financial Statements: Complete annual and quarterly breakdowns for enhanced insights.
- Key Ratios: Integrated analysis for profitability, efficiency, and leverage specific to TTEC.
- Dashboard with Visual Outputs: Charts and tables designed to provide clear, actionable results for TTEC Holdings, Inc. (TTEC).
Disclaimer
All information, articles, and product details provided on this website are for general informational and educational purposes only. We do not claim any ownership over, nor do we intend to infringe upon, any trademarks, copyrights, logos, brand names, or other intellectual property mentioned or depicted on this site. Such intellectual property remains the property of its respective owners, and any references here are made solely for identification or informational purposes, without implying any affiliation, endorsement, or partnership.
We make no representations or warranties, express or implied, regarding the accuracy, completeness, or suitability of any content or products presented. Nothing on this website should be construed as legal, tax, investment, financial, medical, or other professional advice. In addition, no part of this site—including articles or product references—constitutes a solicitation, recommendation, endorsement, advertisement, or offer to buy or sell any securities, franchises, or other financial instruments, particularly in jurisdictions where such activity would be unlawful.
All content is of a general nature and may not address the specific circumstances of any individual or entity. It is not a substitute for professional advice or services. Any actions you take based on the information provided here are strictly at your own risk. You accept full responsibility for any decisions or outcomes arising from your use of this website and agree to release us from any liability in connection with your use of, or reliance upon, the content or products found herein.