
|
Tuya Inc. (Tuya) Évaluation DCF |
Entièrement Modifiable: Adapté À Vos Besoins Dans Excel Ou Sheets
Conception Professionnelle: Modèles Fiables Et Conformes Aux Normes Du Secteur
Pré-Construits Pour Une Utilisation Rapide Et Efficace
Compatible MAC/PC, entièrement débloqué
Aucune Expertise N'Est Requise; Facile À Suivre
Tuya Inc. (TUYA) Bundle
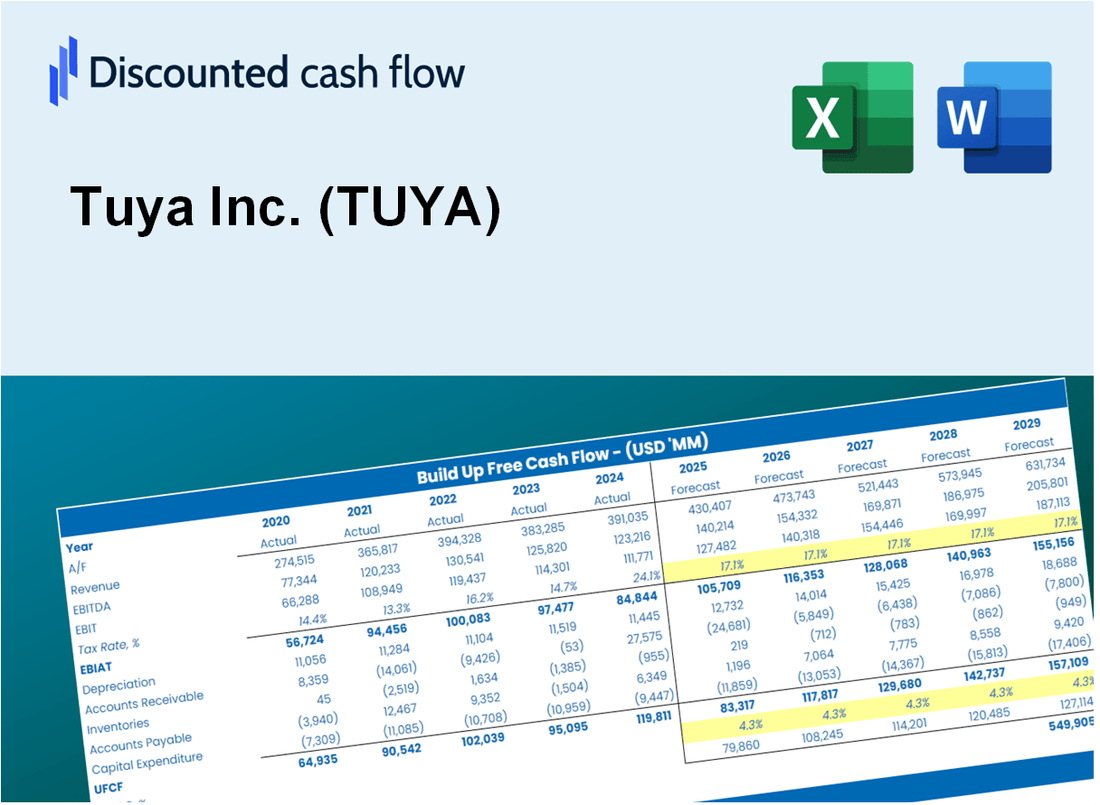
Explorez le potentiel financier de Tuya Inc. (Tuya) avec notre calculatrice DCF facile à utiliser! Entrez vos projections pour la croissance, les marges et les dépenses pour calculer la valeur intrinsèque de Tuya Inc. (Tuya) et façonner votre approche d'investissement.
What You Will Receive
- Customizable Excel Template: A fully adjustable Excel-based DCF Calculator featuring pre-filled real TUYA financials.
- Accurate Data: Historical data and forward-looking projections (highlighted in the yellow cells).
- Flexible Forecasting: Adjust forecast assumptions such as revenue growth, EBITDA %, and WACC.
- Instant Calculations: Quickly observe how your inputs affect Tuya’s valuation.
- Professional Resource: Designed for investors, CFOs, consultants, and financial analysts.
- Intuitive Design: Organized for clarity and user-friendliness, complete with step-by-step guidance.
Key Features
- Comprehensive TUYA Data: Pre-loaded with Tuya Inc.’s historical financial metrics and future growth estimates.
- Customizable Assumptions: Modify revenue growth rates, profit margins, discount rates, tax percentages, and capital expenditures.
- Interactive Valuation Model: Automatically recalculates Net Present Value (NPV) and intrinsic value as you adjust inputs.
- Scenario Analysis: Develop various forecasting scenarios to explore different valuation possibilities.
- Intuitive Interface: Designed to be simple and accessible for both seasoned professionals and newcomers.
How It Works
- Step 1: Download the Excel file.
- Step 2: Review pre-entered Tuya Inc. (TUYA) data (historical and projected).
- Step 3: Adjust key assumptions (yellow cells) based on your analysis.
- Step 4: View automatic recalculations for Tuya Inc.'s intrinsic value.
- Step 5: Use the outputs for investment decisions or reporting.
Why Choose This Calculator for Tuya Inc. (TUYA)?
- Accurate Data: Utilize real Tuya financials for dependable valuation outcomes.
- Customizable: Modify essential parameters such as growth rates, WACC, and tax rates to align with your forecasts.
- Time-Saving: Pre-configured calculations save you from starting from the ground up.
- Professional-Grade Tool: Tailored for investors, analysts, and consultants in the tech industry.
- User-Friendly: Easy-to-navigate design and clear instructions ensure accessibility for all users.
Who Should Use Tuya Inc. (TUYA)?
- Investors: Evaluate Tuya's market position before making investment decisions.
- CFOs and Financial Analysts: Optimize valuation methodologies and assess financial forecasts.
- Startup Founders: Understand the valuation strategies of successful tech companies like Tuya.
- Consultants: Provide in-depth valuation analysis and reports to clients.
- Students and Educators: Utilize current market data to study and teach valuation principles.
What the Tuya Template Contains
- Preloaded TUYA Data: Historical and projected financial data, including revenue, EBIT, and capital expenditures.
- DCF and WACC Models: Professional-grade sheets for calculating intrinsic value and Weighted Average Cost of Capital.
- Editable Inputs: Yellow-highlighted cells for adjusting revenue growth, tax rates, and discount rates.
- Financial Statements: Comprehensive annual and quarterly financials for deeper analysis.
- Key Ratios: Profitability, leverage, and efficiency ratios to evaluate performance.
- Dashboard and Charts: Visual summaries of valuation outcomes and assumptions.
Disclaimer
All information, articles, and product details provided on this website are for general informational and educational purposes only. We do not claim any ownership over, nor do we intend to infringe upon, any trademarks, copyrights, logos, brand names, or other intellectual property mentioned or depicted on this site. Such intellectual property remains the property of its respective owners, and any references here are made solely for identification or informational purposes, without implying any affiliation, endorsement, or partnership.
We make no representations or warranties, express or implied, regarding the accuracy, completeness, or suitability of any content or products presented. Nothing on this website should be construed as legal, tax, investment, financial, medical, or other professional advice. In addition, no part of this site—including articles or product references—constitutes a solicitation, recommendation, endorsement, advertisement, or offer to buy or sell any securities, franchises, or other financial instruments, particularly in jurisdictions where such activity would be unlawful.
All content is of a general nature and may not address the specific circumstances of any individual or entity. It is not a substitute for professional advice or services. Any actions you take based on the information provided here are strictly at your own risk. You accept full responsibility for any decisions or outcomes arising from your use of this website and agree to release us from any liability in connection with your use of, or reliance upon, the content or products found herein.