
|
UCB SA (UCB.BR) Évaluation DCF |
Entièrement Modifiable: Adapté À Vos Besoins Dans Excel Ou Sheets
Conception Professionnelle: Modèles Fiables Et Conformes Aux Normes Du Secteur
Pré-Construits Pour Une Utilisation Rapide Et Efficace
Compatible MAC/PC, entièrement débloqué
Aucune Expertise N'Est Requise; Facile À Suivre
UCB SA (UCB.BR) Bundle
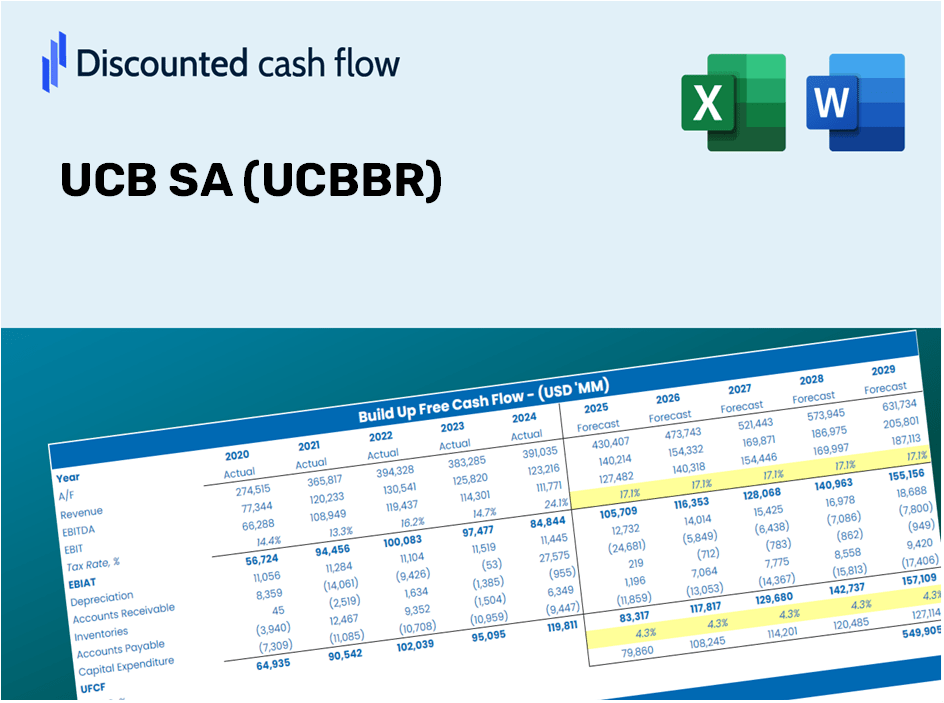
Gardez un aperçu de votre analyse d'évaluation UCB SA (UCBBR) à l'aide de notre calculatrice sophistiquée DCF! Ce modèle Excel est préchargé avec de vraies données UCBBR, vous permettant d'ajuster les prévisions et les hypothèses pour calculer avec précision la valeur intrinsèque d'UCB SA.
What You Will Receive
- Authentic UCB Financials: Access both historical and projected data for precise valuation.
- Customizable Inputs: Adjust WACC, tax rates, revenue growth, and capital expenditures as needed.
- Real-Time Calculations: Intrinsic value and NPV are computed automatically.
- Scenario Analysis: Explore various scenarios to assess UCB SA’s future performance.
- User-Friendly Design: Designed for professionals but easy for newcomers to navigate.
Key Features
- Pre-Loaded Data: UCB SA's historical financial statements and pre-filled forecasts.
- Fully Adjustable Inputs: Modify WACC, tax rates, revenue growth, and EBITDA margins as needed.
- Instant Results: Watch UCB SA’s intrinsic value recalculate in real time.
- Clear Visual Outputs: Dashboard charts provide insights into valuation results and essential metrics.
- Built for Accuracy: A professional-grade tool designed for analysts, investors, and finance professionals.
How It Works
- Step 1: Download the prebuilt Excel template containing UCB SA's data.
- Step 2: Review the pre-filled sheets to familiarize yourself with the essential metrics.
- Step 3: Update the forecasts and assumptions in the editable yellow cells (WACC, growth, margins).
- Step 4: Instantly view the recalculated results, including UCB SA's intrinsic value.
- Step 5: Use the outputs to make informed investment decisions or create detailed reports.
Why Select This Calculator for UCB SA (UCBBR)?
- Time-Saving: Eliminate the hassle of building a DCF model from the ground up – it’s ready for use.
- Enhanced Accuracy: Dependable financial data and formulas minimize valuation errors.
- Completely Customizable: Adjust the model to match your specific assumptions and forecasts.
- Simple to Analyze: Intuitive charts and outputs allow for easy interpretation of results.
- Endorsed by Professionals: Crafted for experts who prioritize precision and ease of use.
Who Can Benefit from UCB SA (UCBBR)?
- Investors: Gain assurance in your investment choices with a high-quality valuation tool.
- Financial Analysts: Streamline your workflow with a customizable pre-built DCF model.
- Consultants: Effortlessly modify the template for presentations or reports tailored to your clients.
- Finance Enthusiasts: Enhance your knowledge of valuation methods through practical, real-world examples.
- Educators and Students: Utilize this resource as an effective learning aid in finance courses.
Contents of the Template
- Pre-Filled Data: Contains UCB SA’s historical financial data and projections.
- Discounted Cash Flow Model: An editable DCF valuation model featuring automatic calculations.
- Weighted Average Cost of Capital (WACC): A separate sheet for WACC calculations based on user-defined inputs.
- Key Financial Ratios: Evaluate UCB SA’s profitability, operational efficiency, and financial leverage.
- Customizable Inputs: Easily adjust revenue growth, profit margins, and tax rates.
- Clear Dashboard: Visuals and tables that summarize essential valuation outcomes.
Disclaimer
All information, articles, and product details provided on this website are for general informational and educational purposes only. We do not claim any ownership over, nor do we intend to infringe upon, any trademarks, copyrights, logos, brand names, or other intellectual property mentioned or depicted on this site. Such intellectual property remains the property of its respective owners, and any references here are made solely for identification or informational purposes, without implying any affiliation, endorsement, or partnership.
We make no representations or warranties, express or implied, regarding the accuracy, completeness, or suitability of any content or products presented. Nothing on this website should be construed as legal, tax, investment, financial, medical, or other professional advice. In addition, no part of this site—including articles or product references—constitutes a solicitation, recommendation, endorsement, advertisement, or offer to buy or sell any securities, franchises, or other financial instruments, particularly in jurisdictions where such activity would be unlawful.
All content is of a general nature and may not address the specific circumstances of any individual or entity. It is not a substitute for professional advice or services. Any actions you take based on the information provided here are strictly at your own risk. You accept full responsibility for any decisions or outcomes arising from your use of this website and agree to release us from any liability in connection with your use of, or reliance upon, the content or products found herein.