
|
UTI Asset Management Company Limited (utiamc.NS) Évaluation DCF |
Entièrement Modifiable: Adapté À Vos Besoins Dans Excel Ou Sheets
Conception Professionnelle: Modèles Fiables Et Conformes Aux Normes Du Secteur
Pré-Construits Pour Une Utilisation Rapide Et Efficace
Compatible MAC/PC, entièrement débloqué
Aucune Expertise N'Est Requise; Facile À Suivre
UTI Asset Management Company Limited (UTIAMC.NS) Bundle
Rationalisez votre analyse et améliorez la précision avec notre calculatrice DCF (utiamcns)! Propulsé par la société de gestion d'actifs UTI en temps réel Limited Data et Hypothèses personnalisables, cet outil vous permet de prévoir, d'évaluer et d'évaluer la gestion des actifs UTI comme un investisseur chevronné.
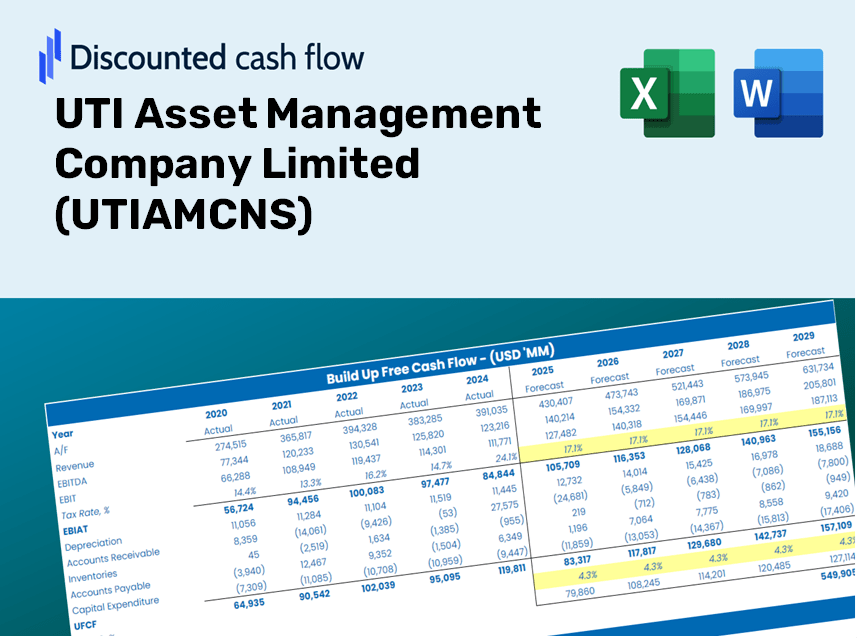
Discounted Cash Flow (DCF) - (USD MM)
| Year | AY1 2021 |
AY2 2022 |
AY3 2023 |
AY4 2024 |
AY5 2025 |
FY1 2026 |
FY2 2027 |
FY3 2028 |
FY4 2029 |
FY5 2030 |
|---|---|---|---|---|---|---|---|---|---|---|
| Revenue | 8,809.4 | 11,188.5 | 12,543.9 | 17,369.6 | 18,510.9 | 22,405.7 | 27,119.9 | 32,826.1 | 39,732.8 | 48,092.8 |
| Revenue Growth, % | 0 | 27.01 | 12.11 | 38.47 | 6.57 | 21.04 | 21.04 | 21.04 | 21.04 | 21.04 |
| EBITDA | 6,478.3 | 7,151.1 | 6,451.8 | 10,409.7 | 11,015.7 | 13,816.5 | 16,723.6 | 20,242.3 | 24,501.4 | 29,656.6 |
| EBITDA, % | 73.54 | 63.91 | 51.43 | 59.93 | 59.51 | 61.67 | 61.67 | 61.67 | 61.67 | 61.67 |
| Depreciation | 357.8 | 368.2 | 399.4 | 417.4 | 455.4 | 690.1 | 835.3 | 1,011.0 | 1,223.7 | 1,481.2 |
| Depreciation, % | 4.06 | 3.29 | 3.18 | 2.4 | 2.46 | 3.08 | 3.08 | 3.08 | 3.08 | 3.08 |
| EBIT | 6,120.5 | 6,782.9 | 6,052.4 | 9,992.3 | 10,560.3 | 13,126.5 | 15,888.3 | 19,231.3 | 23,277.7 | 28,175.4 |
| EBIT, % | 69.48 | 60.62 | 48.25 | 57.53 | 57.05 | 58.59 | 58.59 | 58.59 | 58.59 | 58.59 |
| Total Cash | 12,826.8 | 19,631.5 | 3,572.1 | 23,329.4 | 46,469.2 | 19,200.6 | 23,240.5 | 28,130.4 | 34,049.2 | 41,213.3 |
| Total Cash, percent | .0 | .0 | .0 | .0 | .0 | .0 | .0 | .0 | .0 | .0 |
| Account Receivables | 455.2 | 800.9 | 938.1 | 833.4 | 797.2 | 1,295.4 | 1,568.0 | 1,897.9 | 2,297.2 | 2,780.6 |
| Account Receivables, % | 5.17 | 7.16 | 7.48 | 4.8 | 4.31 | 5.78 | 5.78 | 5.78 | 5.78 | 5.78 |
| Inventories | 548.4 | 247.1 | -15.8 | .0 | .0 | 372.3 | 450.6 | 545.4 | 660.2 | 799.1 |
| Inventories, % | 6.23 | 2.21 | -0.12596 | 0 | 0 | 1.66 | 1.66 | 1.66 | 1.66 | 1.66 |
| Accounts Payable | 36.3 | 61.8 | 506.2 | 277.0 | 623.5 | 446.4 | 540.4 | 654.1 | 791.7 | 958.3 |
| Accounts Payable, % | 0.41206 | 0.55235 | 4.04 | 1.59 | 3.37 | 1.99 | 1.99 | 1.99 | 1.99 | 1.99 |
| Capital Expenditure | -421.2 | -378.6 | -1,089.4 | -1,465.9 | -698.2 | -1,302.3 | -1,576.3 | -1,907.9 | -2,309.4 | -2,795.3 |
| Capital Expenditure, % | -4.78 | -3.38 | -8.68 | -8.44 | -3.77 | -5.81 | -5.81 | -5.81 | -5.81 | -5.81 |
| Tax Rate, % | 30.48 | 30.48 | 30.48 | 30.48 | 30.48 | 30.48 | 30.48 | 30.48 | 30.48 | 30.48 |
| EBITAT | 5,015.3 | 5,489.5 | 4,520.1 | 7,752.9 | 7,341.7 | 10,098.7 | 12,223.5 | 14,795.3 | 17,908.3 | 21,676.3 |
| Depreciation | ||||||||||
| Changes in Account Receivables | ||||||||||
| Changes in Inventories | ||||||||||
| Changes in Accounts Payable | ||||||||||
| Capital Expenditure | ||||||||||
| UFCF | 3,984.6 | 5,460.2 | 4,400.2 | 6,564.1 | 7,481.6 | 8,438.9 | 11,225.5 | 13,587.4 | 16,446.3 | 19,906.6 |
| WACC, % | 6.14 | 6.14 | 6.14 | 6.14 | 6.13 | 6.14 | 6.14 | 6.14 | 6.14 | 6.14 |
| PV UFCF | ||||||||||
| SUM PV UFCF | 57,015.7 | |||||||||
| Long Term Growth Rate, % | 2.00 | |||||||||
| Free cash flow (T + 1) | 20,305 | |||||||||
| Terminal Value | 490,559 | |||||||||
| Present Terminal Value | 364,178 | |||||||||
| Enterprise Value | 421,194 | |||||||||
| Net Debt | -3,499 | |||||||||
| Equity Value | 424,693 | |||||||||
| Diluted Shares Outstanding, MM | 128 | |||||||||
| Equity Value Per Share | 3,315.74 |
What You Will Receive
- Genuine UTI Data: Preloaded financial metrics – encompassing revenue to EBIT – derived from actual and projected statistics.
- Comprehensive Customization: Modify all essential parameters (yellow cells) such as WACC, growth %, and tax rates.
- Immediate Valuation Updates: Automatic recalculations to evaluate the effect of changes on UTI's fair value.
- Flexible Excel Template: Designed for quick adjustments, scenario analysis, and in-depth projections.
- Efficient and Precise: Bypass the need to construct models from scratch while ensuring accuracy and adaptability.
Key Features
- Pre-Loaded Data: UTI Asset Management Company Limited’s comprehensive historical financial statements and pre-populated forecasts.
- Fully Adjustable Inputs: Customize WACC, tax rates, revenue growth, and EBITDA margins to fit your analysis.
- Instant Results: Watch the intrinsic value of UTI Asset Management Company Limited (UTIAMCNS) update in real time.
- Clear Visual Outputs: Intuitive dashboard charts present valuation results and key financial metrics.
- Built for Accuracy: A professional-grade tool designed for analysts, investors, and finance professionals.
How It Operates
- 1. Access the Template: Download and open the Excel file containing UTI Asset Management Company Limited's (UTIAMCNS) preloaded data.
- 2. Modify Assumptions: Adjust critical inputs such as growth rates, WACC, and capital expenditures.
- 3. View Instant Results: The DCF model automatically calculates intrinsic value and NPV in real-time.
- 4. Explore Scenarios: Analyze different valuation outcomes by comparing multiple forecasts.
- 5. Present with Confidence: Deliver professional valuation insights to bolster your decision-making.
Why Opt for This Calculator?
- Reliable Data: Utilize authentic UTI AMC financial figures for trustworthy valuation outcomes.
- Customizable Options: Tailor key inputs such as growth rates, WACC, and tax rates to align with your forecasts.
- Efficient: Ready-to-use calculations save you from starting from the ground up.
- Professional-Quality Tool: Crafted for investors, analysts, and consultants alike.
- User-Friendly Interface: Streamlined design and clear instructions make it accessible for everyone.
Who Should Consider UTI Asset Management Company Limited (UTIAMCNS)?
- Individual Investors: Enhance your investment strategies with insights from UTIAMC's expertise.
- Financial Analysts: Improve your analysis with access to comprehensive financial models and tools.
- Consultants: Provide your clients with accurate asset management solutions backed by UTIAMC's reputation.
- Business Owners: Gain insights into market trends and valuation techniques to better inform your business decisions.
- Finance Students: Acquire practical knowledge of asset management and investment strategies through real-world case studies.
Contents of the Template
- Operating and Balance Sheet Data: Pre-populated historical data and forecasts for UTI Asset Management Company Limited (UTIAMCNS), including metrics like revenue, EBITDA, EBIT, and capital expenditures.
- WACC Calculation: A specific sheet dedicated to the Weighted Average Cost of Capital (WACC), featuring key parameters such as Beta, risk-free rate, and share price.
- DCF Valuation (Unlevered and Levered): Customizable Discounted Cash Flow models that illustrate intrinsic value with comprehensive calculations.
- Financial Statements: Pre-loaded annual and quarterly financial statements to facilitate thorough analysis.
- Key Ratios: An overview of profitability, leverage, and efficiency ratios relevant to UTI Asset Management Company Limited (UTIAMCNS).
- Dashboard and Charts: A visual summary of valuation outcomes and underlying assumptions for easy result analysis.
Disclaimer
All information, articles, and product details provided on this website are for general informational and educational purposes only. We do not claim any ownership over, nor do we intend to infringe upon, any trademarks, copyrights, logos, brand names, or other intellectual property mentioned or depicted on this site. Such intellectual property remains the property of its respective owners, and any references here are made solely for identification or informational purposes, without implying any affiliation, endorsement, or partnership.
We make no representations or warranties, express or implied, regarding the accuracy, completeness, or suitability of any content or products presented. Nothing on this website should be construed as legal, tax, investment, financial, medical, or other professional advice. In addition, no part of this site—including articles or product references—constitutes a solicitation, recommendation, endorsement, advertisement, or offer to buy or sell any securities, franchises, or other financial instruments, particularly in jurisdictions where such activity would be unlawful.
All content is of a general nature and may not address the specific circumstances of any individual or entity. It is not a substitute for professional advice or services. Any actions you take based on the information provided here are strictly at your own risk. You accept full responsibility for any decisions or outcomes arising from your use of this website and agree to release us from any liability in connection with your use of, or reliance upon, the content or products found herein.