
|
Veritex Holdings, Inc. (VBTX) Évaluation DCF |
Entièrement Modifiable: Adapté À Vos Besoins Dans Excel Ou Sheets
Conception Professionnelle: Modèles Fiables Et Conformes Aux Normes Du Secteur
Pré-Construits Pour Une Utilisation Rapide Et Efficace
Compatible MAC/PC, entièrement débloqué
Aucune Expertise N'Est Requise; Facile À Suivre
Veritex Holdings, Inc. (VBTX) Bundle
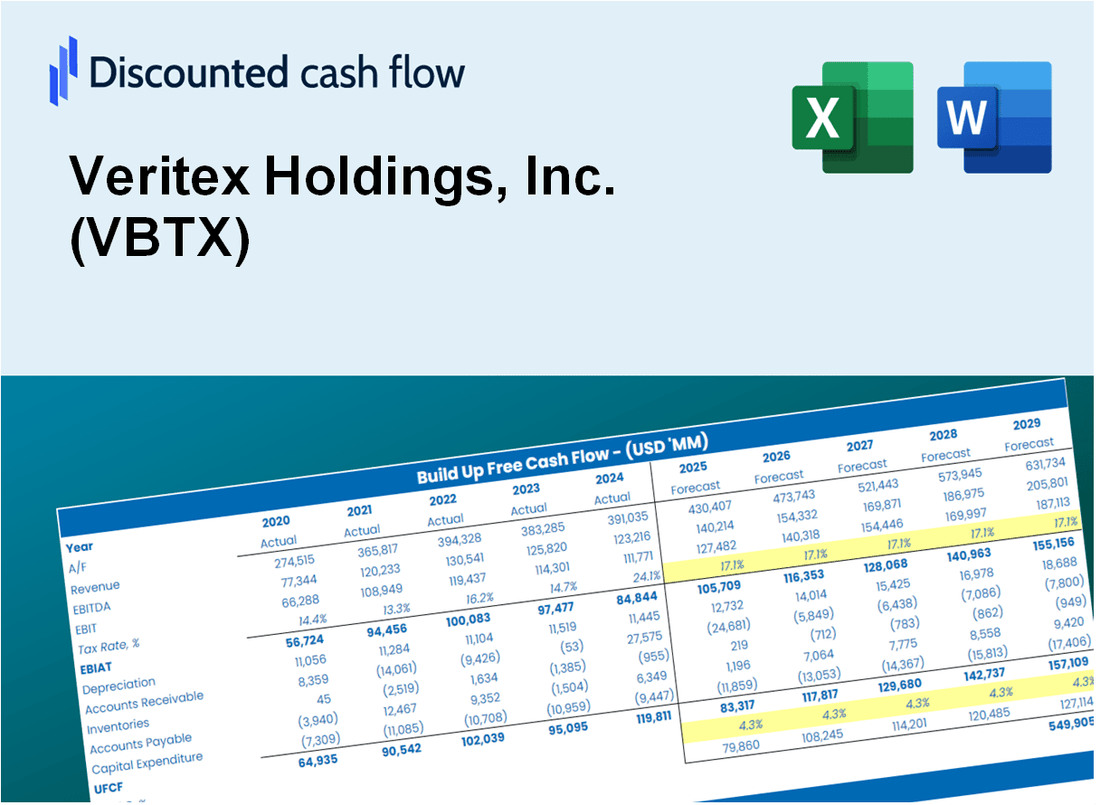
Vous cherchez à évaluer la valeur intrinsèque de Veritex Holdings, Inc.? Notre calculatrice DCF (VBTX) intègre des données réelles avec des fonctionnalités de personnalisation complètes, vous permettant d'affiner vos prévisions et de faire des choix d'investissement plus éclairés.
What You Will Get
- Real Veritex Data: Preloaded financials – from revenue to EBIT – based on actual and projected figures.
- Full Customization: Adjust all critical parameters (yellow cells) like WACC, growth %, and tax rates.
- Instant Valuation Updates: Automatic recalculations to analyze the impact of changes on Veritex Holdings’ fair value.
- Versatile Excel Template: Tailored for quick edits, scenario testing, and detailed projections.
- Time-Saving and Accurate: Skip building models from scratch while maintaining precision and flexibility.
Key Features
- Comprehensive VBTX Data: Pre-filled with Veritex Holdings' historical financials and future projections.
- Fully Customizable Inputs: Modify revenue growth rates, profit margins, WACC, tax rates, and capital expenditures as needed.
- Dynamic Valuation Model: Automatically updates Net Present Value (NPV) and intrinsic value based on your customized inputs.
- Scenario Testing: Develop multiple forecasting scenarios to evaluate various valuation outcomes.
- User-Friendly Design: Intuitive, organized, and crafted for both professionals and newcomers.
How It Works
- Step 1: Download the Excel file for Veritex Holdings, Inc. (VBTX).
- Step 2: Review the pre-filled financial data and forecasts specific to Veritex Holdings.
- Step 3: Adjust key inputs such as revenue growth, WACC, and tax rates (highlighted cells).
- Step 4: Observe the DCF model update in real-time as you modify your assumptions.
- Step 5: Evaluate the outputs and leverage the results for your investment strategies.
Why Choose This Calculator for Veritex Holdings, Inc. (VBTX)?
- Accurate Data: Utilize real Veritex financials for dependable valuation outcomes.
- Customizable: Tailor key inputs such as growth rates, WACC, and tax rates to fit your forecasts.
- Time-Saving: Built-in calculations streamline the process, saving you valuable time.
- Professional-Grade Tool: Crafted for investors, analysts, and financial consultants.
- User-Friendly: Easy-to-navigate design and clear instructions cater to users of all experience levels.
Who Should Use This Product?
- Finance Students: Master financial analysis techniques and apply them to real-world data for Veritex Holdings, Inc. (VBTX).
- Academics: Integrate industry-standard models into your curriculum or research projects involving Veritex Holdings, Inc. (VBTX).
- Investors: Evaluate your investment strategies and analyze the valuation metrics for Veritex Holdings, Inc. (VBTX).
- Analysts: Enhance your analytical processes with a customizable financial model tailored for Veritex Holdings, Inc. (VBTX).
- Small Business Owners: Understand the financial evaluation methods used for publicly traded companies like Veritex Holdings, Inc. (VBTX).
What the Template Contains
- Operating and Balance Sheet Data: Pre-filled Veritex Holdings historical data and forecasts, including revenue, EBITDA, EBIT, and capital expenditures.
- WACC Calculation: A dedicated sheet for Weighted Average Cost of Capital (WACC), including parameters like Beta, risk-free rate, and share price.
- DCF Valuation (Unlevered and Levered): Editable Discounted Cash Flow models showing intrinsic value with detailed calculations.
- Financial Statements: Pre-loaded financial statements (annual and quarterly) to support analysis.
- Key Ratios: Includes profitability, leverage, and efficiency ratios for Veritex Holdings, Inc. (VBTX).
- Dashboard and Charts: Visual summary of valuation outputs and assumptions to analyze results easily.
Disclaimer
All information, articles, and product details provided on this website are for general informational and educational purposes only. We do not claim any ownership over, nor do we intend to infringe upon, any trademarks, copyrights, logos, brand names, or other intellectual property mentioned or depicted on this site. Such intellectual property remains the property of its respective owners, and any references here are made solely for identification or informational purposes, without implying any affiliation, endorsement, or partnership.
We make no representations or warranties, express or implied, regarding the accuracy, completeness, or suitability of any content or products presented. Nothing on this website should be construed as legal, tax, investment, financial, medical, or other professional advice. In addition, no part of this site—including articles or product references—constitutes a solicitation, recommendation, endorsement, advertisement, or offer to buy or sell any securities, franchises, or other financial instruments, particularly in jurisdictions where such activity would be unlawful.
All content is of a general nature and may not address the specific circumstances of any individual or entity. It is not a substitute for professional advice or services. Any actions you take based on the information provided here are strictly at your own risk. You accept full responsibility for any decisions or outcomes arising from your use of this website and agree to release us from any liability in connection with your use of, or reliance upon, the content or products found herein.