
|
Veru Inc. (VERU) VALUATION DCF |
Entièrement Modifiable: Adapté À Vos Besoins Dans Excel Ou Sheets
Conception Professionnelle: Modèles Fiables Et Conformes Aux Normes Du Secteur
Pré-Construits Pour Une Utilisation Rapide Et Efficace
Compatible MAC/PC, entièrement débloqué
Aucune Expertise N'Est Requise; Facile À Suivre
Veru Inc. (VERU) Bundle
Découvrez la vraie valeur de Veru Inc. (VERU) avec notre calculatrice DCF de qualité professionnelle! Ajustez les hypothèses clés, explorez divers scénarios et analysez comment les changements affectent la valorisation Veru Inc. (VERU) - le tout dans un seul modèle Excel.
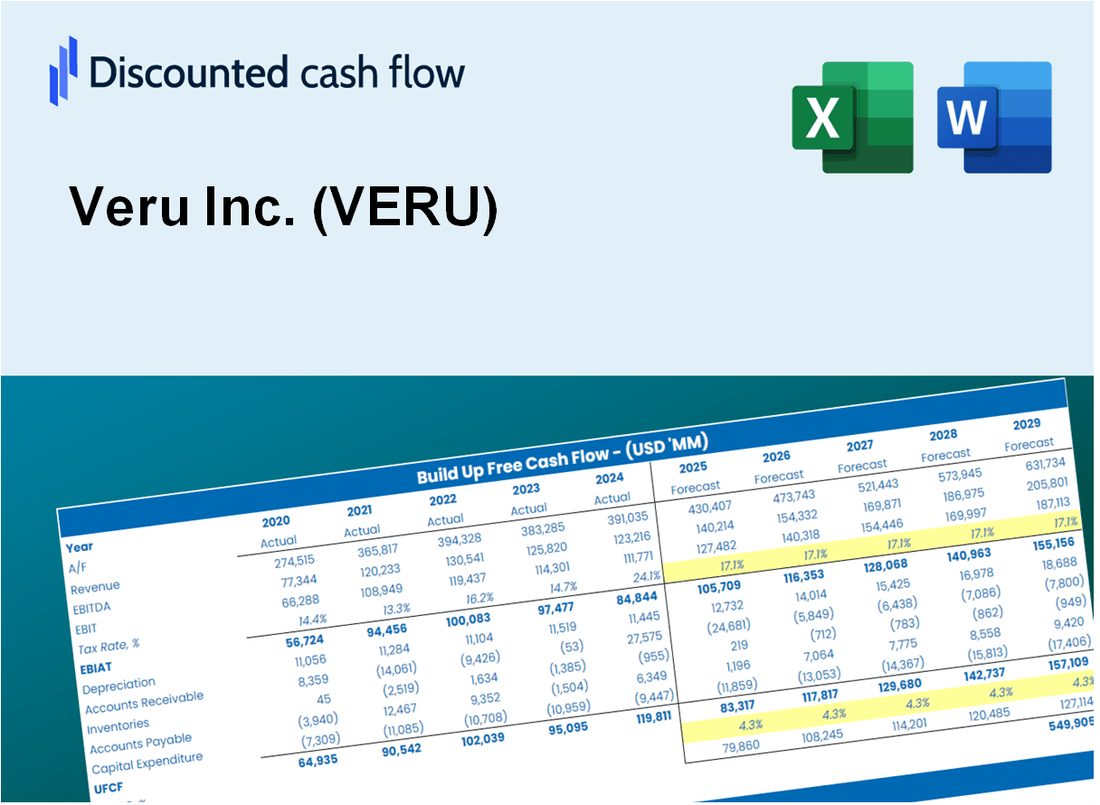
Discounted Cash Flow (DCF) - (USD MM)
| Year | AY1 2020 |
AY2 2021 |
AY3 2022 |
AY4 2023 |
AY5 2024 |
FY1 2025 |
FY2 2026 |
FY3 2027 |
FY4 2028 |
FY5 2029 |
|---|---|---|---|---|---|---|---|---|---|---|
| Revenue | 42.6 | 61.3 | 39.4 | 16.3 | 16.9 | 14.9 | 13.2 | 11.6 | 10.3 | 9.1 |
| Revenue Growth, % | 0 | 43.83 | -35.76 | -58.59 | 3.62 | -11.73 | -11.73 | -11.73 | -11.73 | -11.73 |
| EBITDA | -14.6 | 9.7 | -79.2 | -90.0 | -36.2 | -9.5 | -8.4 | -7.4 | -6.5 | -5.8 |
| EBITDA, % | -34.39 | 15.91 | -201.31 | -552.1 | -214.38 | -63.7 | -63.7 | -63.7 | -63.7 | -63.7 |
| Depreciation | .8 | .6 | .2 | .3 | .3 | .2 | .2 | .2 | .1 | .1 |
| Depreciation, % | 1.84 | 0.96943 | 0.53258 | 1.66 | 1.59 | 1.32 | 1.32 | 1.32 | 1.32 | 1.32 |
| EBIT | -15.4 | 9.2 | -79.4 | -90.2 | -36.5 | -9.6 | -8.5 | -7.5 | -6.6 | -5.8 |
| EBIT, % | -36.23 | 14.94 | -201.85 | -553.76 | -215.97 | -64.26 | -64.26 | -64.26 | -64.26 | -64.26 |
| Total Cash | 13.6 | 122.4 | 80.2 | 9.6 | 24.9 | 11.7 | 10.3 | 9.1 | 8.0 | 7.1 |
| Total Cash, percent | .0 | .0 | .0 | .0 | .0 | .0 | .0 | .0 | .0 | .0 |
| Account Receivables | 5.2 | 13.8 | 3.6 | 4.5 | 4.0 | 2.8 | 2.5 | 2.2 | 1.9 | 1.7 |
| Account Receivables, % | 12.27 | 22.52 | 9.02 | 27.65 | 23.45 | 18.98 | 18.98 | 18.98 | 18.98 | 18.98 |
| Inventories | 6.7 | 5.6 | 8.6 | 6.7 | 4.1 | 3.4 | 3.0 | 2.6 | 2.3 | 2.0 |
| Inventories, % | 15.74 | 9.1 | 21.9 | 41.09 | 24.54 | 22.48 | 22.48 | 22.48 | 22.48 | 22.48 |
| Accounts Payable | 2.8 | 3.4 | 22.0 | 12.9 | 3.0 | 4.9 | 4.4 | 3.8 | 3.4 | 3.0 |
| Accounts Payable, % | 6.6 | 5.57 | 55.91 | 79.35 | 17.98 | 33.08 | 33.08 | 33.08 | 33.08 | 33.08 |
| Capital Expenditure | -.1 | -.4 | -.7 | -.7 | -.2 | -.2 | -.2 | -.2 | -.2 | -.1 |
| Capital Expenditure, % | -0.24831 | -0.61484 | -1.86 | -4.08 | -0.93757 | -1.55 | -1.55 | -1.55 | -1.55 | -1.55 |
| Tax Rate, % | -1.96 | -1.96 | -1.96 | -1.96 | -1.96 | -1.96 | -1.96 | -1.96 | -1.96 | -1.96 |
| EBITAT | -14.6 | 15.9 | -79.4 | -90.7 | -37.2 | -9.5 | -8.4 | -7.4 | -6.5 | -5.8 |
| Depreciation | ||||||||||
| Changes in Account Receivables | ||||||||||
| Changes in Inventories | ||||||||||
| Changes in Accounts Payable | ||||||||||
| Capital Expenditure | ||||||||||
| UFCF | -23.0 | 9.2 | -54.1 | -99.2 | -43.9 | -5.7 | -8.2 | -7.3 | -6.4 | -5.7 |
| WACC, % | 4.53 | 4.6 | 4.6 | 4.6 | 4.6 | 4.58 | 4.58 | 4.58 | 4.58 | 4.58 |
| PV UFCF | ||||||||||
| SUM PV UFCF | -29.3 | |||||||||
| Long Term Growth Rate, % | 2.00 | |||||||||
| Free cash flow (T + 1) | -6 | |||||||||
| Terminal Value | -224 | |||||||||
| Present Terminal Value | -179 | |||||||||
| Enterprise Value | -208 | |||||||||
| Net Debt | -11 | |||||||||
| Equity Value | -197 | |||||||||
| Diluted Shares Outstanding, MM | 13 | |||||||||
| Equity Value Per Share | -14.62 |
What You Will Get
- Real VERU Financial Data: Pre-filled with Veru Inc.’s historical and projected data for precise analysis.
- Fully Editable Template: Modify key inputs like revenue growth, WACC, and EBITDA % with ease.
- Automatic Calculations: See Veru Inc.’s intrinsic value update instantly based on your changes.
- Professional Valuation Tool: Designed for investors, analysts, and consultants seeking accurate DCF results.
- User-Friendly Design: Simple structure and clear instructions for all experience levels.
Key Features
- Real Veru Financials: Access accurate pre-loaded historical data and future projections for Veru Inc. (VERU).
- Customizable Forecast Assumptions: Edit yellow-highlighted cells such as WACC, growth rates, and margins tailored for Veru Inc. (VERU).
- Dynamic Calculations: Automatic updates to DCF, Net Present Value (NPV), and cash flow analysis specific to Veru Inc. (VERU).
- Visual Dashboard: Easy-to-read charts and summaries to visualize your valuation results for Veru Inc. (VERU).
- For Professionals and Beginners: A simple, intuitive structure designed for investors, CFOs, and consultants focusing on Veru Inc. (VERU).
How It Works
- 1. Access the Model: Download and open the Excel file featuring Veru Inc.'s (VERU) comprehensive data.
- 2. Adjust Key Inputs: Modify essential variables such as growth projections, WACC, and capital expenditures.
- 3. Analyze Results Immediately: The DCF model automatically computes intrinsic value and NPV in real-time.
- 4. Explore Different Scenarios: Evaluate various forecasts to understand diverse valuation possibilities.
- 5. Present with Assurance: Deliver professional valuation analyses to enhance your decision-making process.
Why Choose This Calculator for Veru Inc. (VERU)?
- Accuracy: Utilizes real Veru financials to ensure precise data.
- Flexibility: Allows users to freely test and adjust inputs as needed.
- Time-Saving: Eliminate the complexities of creating a DCF model from the ground up.
- Professional-Grade: Crafted with the precision and usability expected at the CFO level.
- User-Friendly: Intuitive design makes it accessible for users without extensive financial modeling skills.
Who Should Use Veru Inc. (VERU)?
- Healthcare Investors: Develop comprehensive and trustworthy valuation models for investment analysis.
- Pharmaceutical Finance Teams: Evaluate valuation scenarios to inform strategic decisions within the company.
- Consultants and Advisors: Offer clients precise valuation insights for Veru Inc. (VERU) stock.
- Students and Educators: Utilize real-world data to practice and teach financial modeling in the healthcare sector.
- Biotech Enthusiasts: Gain insights into how biotech companies like Veru Inc. (VERU) are valued in the market.
What the Template Contains
- Operating and Balance Sheet Data: Pre-filled Veru Inc. (VERU) historical data and forecasts, including revenue, EBITDA, EBIT, and capital expenditures.
- WACC Calculation: A dedicated sheet for Weighted Average Cost of Capital (WACC), including parameters like Beta, risk-free rate, and share price.
- DCF Valuation (Unlevered and Levered): Editable Discounted Cash Flow models showing intrinsic value with detailed calculations.
- Financial Statements: Pre-loaded financial statements (annual and quarterly) to support analysis.
- Key Ratios: Includes profitability, leverage, and efficiency ratios for Veru Inc. (VERU).
- Dashboard and Charts: Visual summary of valuation outputs and assumptions to analyze results easily.
Disclaimer
All information, articles, and product details provided on this website are for general informational and educational purposes only. We do not claim any ownership over, nor do we intend to infringe upon, any trademarks, copyrights, logos, brand names, or other intellectual property mentioned or depicted on this site. Such intellectual property remains the property of its respective owners, and any references here are made solely for identification or informational purposes, without implying any affiliation, endorsement, or partnership.
We make no representations or warranties, express or implied, regarding the accuracy, completeness, or suitability of any content or products presented. Nothing on this website should be construed as legal, tax, investment, financial, medical, or other professional advice. In addition, no part of this site—including articles or product references—constitutes a solicitation, recommendation, endorsement, advertisement, or offer to buy or sell any securities, franchises, or other financial instruments, particularly in jurisdictions where such activity would be unlawful.
All content is of a general nature and may not address the specific circumstances of any individual or entity. It is not a substitute for professional advice or services. Any actions you take based on the information provided here are strictly at your own risk. You accept full responsibility for any decisions or outcomes arising from your use of this website and agree to release us from any liability in connection with your use of, or reliance upon, the content or products found herein.