
|
Vetoquinol SA (veto.pa) Évaluation DCF |
Entièrement Modifiable: Adapté À Vos Besoins Dans Excel Ou Sheets
Conception Professionnelle: Modèles Fiables Et Conformes Aux Normes Du Secteur
Pré-Construits Pour Une Utilisation Rapide Et Efficace
Compatible MAC/PC, entièrement débloqué
Aucune Expertise N'Est Requise; Facile À Suivre
Vetoquinol SA (VETO.PA) Bundle
Évaluez les perspectives financières de Vetoquinol SA comme un expert! Cette calculatrice DCF (Vetopa) fournit des données financières pré-remplies et vous offre la flexibilité pour modifier la croissance des revenus, le WACC, les marges et d'autres hypothèses essentielles pour s'aligner sur vos projections.
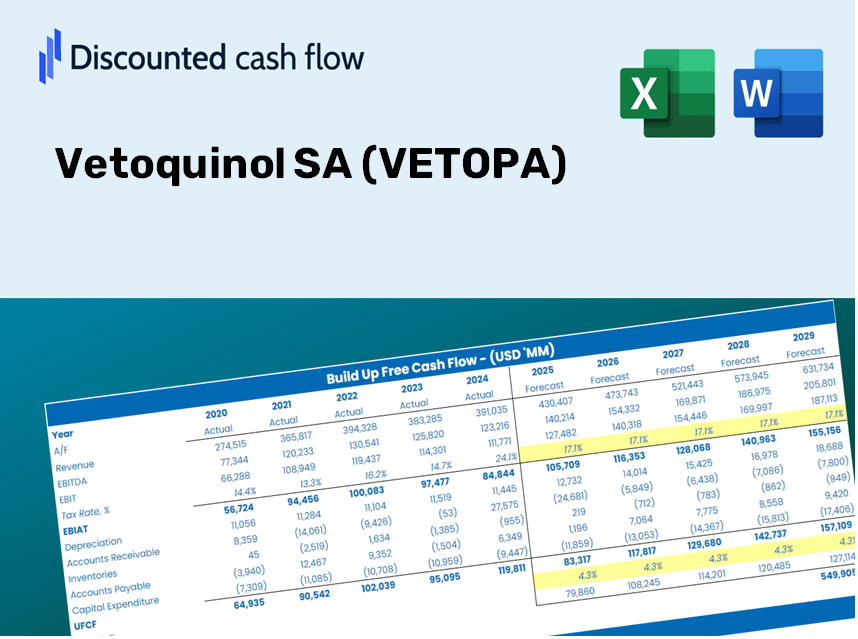
Discounted Cash Flow (DCF) - (USD MM)
| Year | AY1 2020 |
AY2 2021 |
AY3 2022 |
AY4 2023 |
AY5 2024 |
FY1 2025 |
FY2 2026 |
FY3 2027 |
FY4 2028 |
FY5 2029 |
|---|---|---|---|---|---|---|---|---|---|---|
| Revenue | 427.5 | 521.3 | 539.8 | 529.3 | 539.2 | 573.5 | 609.9 | 648.7 | 689.9 | 733.8 |
| Revenue Growth, % | 0 | 21.94 | 3.55 | -1.95 | 1.88 | 6.36 | 6.36 | 6.36 | 6.36 | 6.36 |
| EBITDA | 59.3 | 116.9 | 103.5 | 112.3 | 114.1 | 112.2 | 119.3 | 126.9 | 135.0 | 143.6 |
| EBITDA, % | 13.87 | 22.42 | 19.17 | 21.22 | 21.16 | 19.57 | 19.57 | 19.57 | 19.57 | 19.57 |
| Depreciation | 25.9 | 32.9 | 31.6 | 34.5 | 32.0 | 35.2 | 37.4 | 39.8 | 42.3 | 45.0 |
| Depreciation, % | 6.05 | 6.31 | 5.84 | 6.52 | 5.93 | 6.13 | 6.13 | 6.13 | 6.13 | 6.13 |
| EBIT | 33.4 | 84.0 | 71.9 | 77.8 | 82.1 | 77.0 | 81.9 | 87.2 | 92.7 | 98.6 |
| EBIT, % | 7.82 | 16.11 | 13.32 | 14.7 | 15.22 | 13.44 | 13.44 | 13.44 | 13.44 | 13.44 |
| Total Cash | 129.4 | 69.0 | 93.7 | 147.5 | 206.3 | 145.7 | 154.9 | 164.8 | 175.2 | 186.4 |
| Total Cash, percent | .0 | .0 | .0 | .0 | .0 | .0 | .0 | .0 | .0 | .0 |
| Account Receivables | 87.7 | 85.8 | 83.8 | 97.2 | 92.6 | 100.9 | 107.4 | 114.2 | 121.4 | 129.2 |
| Account Receivables, % | 20.51 | 16.46 | 15.52 | 18.36 | 17.17 | 17.6 | 17.6 | 17.6 | 17.6 | 17.6 |
| Inventories | 85.5 | 111.6 | 116.1 | 103.5 | 112.3 | 118.5 | 126.0 | 134.0 | 142.5 | 151.6 |
| Inventories, % | 20.01 | 21.41 | 21.51 | 19.56 | 20.82 | 20.66 | 20.66 | 20.66 | 20.66 | 20.66 |
| Accounts Payable | 41.5 | 46.9 | 39.0 | 42.0 | 39.4 | 47.2 | 50.2 | 53.4 | 56.8 | 60.4 |
| Accounts Payable, % | 9.7 | 9 | 7.23 | 7.94 | 7.31 | 8.24 | 8.24 | 8.24 | 8.24 | 8.24 |
| Capital Expenditure | -145.5 | -32.4 | -22.5 | -19.0 | -17.7 | -58.8 | -62.6 | -66.5 | -70.8 | -75.3 |
| Capital Expenditure, % | -34.03 | -6.22 | -4.17 | -3.59 | -3.28 | -10.26 | -10.26 | -10.26 | -10.26 | -10.26 |
| Tax Rate, % | 27.56 | 27.56 | 27.56 | 27.56 | 27.56 | 27.56 | 27.56 | 27.56 | 27.56 | 27.56 |
| EBITAT | 17.9 | 61.0 | 47.4 | 56.2 | 59.5 | 51.9 | 55.2 | 58.7 | 62.5 | 66.4 |
| Depreciation | ||||||||||
| Changes in Account Receivables | ||||||||||
| Changes in Inventories | ||||||||||
| Changes in Accounts Payable | ||||||||||
| Capital Expenditure | ||||||||||
| UFCF | -233.4 | 42.8 | 46.1 | 73.8 | 67.0 | 21.5 | 19.1 | 20.3 | 21.6 | 23.0 |
| WACC, % | 8.29 | 8.32 | 8.31 | 8.32 | 8.32 | 8.31 | 8.31 | 8.31 | 8.31 | 8.31 |
| PV UFCF | ||||||||||
| SUM PV UFCF | 83.3 | |||||||||
| Long Term Growth Rate, % | 2.00 | |||||||||
| Free cash flow (T + 1) | 23 | |||||||||
| Terminal Value | 372 | |||||||||
| Present Terminal Value | 249 | |||||||||
| Enterprise Value | 333 | |||||||||
| Net Debt | -185 | |||||||||
| Equity Value | 518 | |||||||||
| Diluted Shares Outstanding, MM | 12 | |||||||||
| Equity Value Per Share | 43.89 |
What You'll Receive
- Accurate VETOPA Financials: Features historical data and forecasts for precise valuation.
- Customizable Inputs: Adjust WACC, tax rates, revenue growth, and capital expenditures as needed.
- Dynamic Calculations: Intrinsic value and NPV are computed in real-time.
- Scenario Analysis: Evaluate various scenarios to assess Vetoquinol’s future prospects.
- User-Friendly Interface: Designed for professionals while remaining accessible for newcomers.
Key Features
- Comprehensive DCF Calculator: Offers in-depth unlevered and levered DCF valuation models tailored for Vetoquinol SA.
- WACC Calculator: Features a pre-configured Weighted Average Cost of Capital sheet with adjustable parameters.
- Customizable Forecast Assumptions: Easily update growth rates, capital expenditures, and discount rates to fit Vetoquinol SA's projections.
- Integrated Financial Ratios: Evaluate profitability, leverage, and efficiency ratios specifically for Vetoquinol SA (VETOPA).
- Interactive Dashboard and Charts: Visual representations provide a clear summary of key valuation metrics for straightforward analysis.
How It Works
- Step 1: Download the Excel file.
- Step 2: Review the pre-filled Vetoquinol SA (VETOPA) data (historical and projected).
- Step 3: Modify key assumptions (yellow cells) according to your analysis.
- Step 4: Observe automatic recalculations for Vetoquinol SA's intrinsic value.
- Step 5: Utilize the results for investment decisions or reporting purposes.
Why Choose This Calculator for Vetoquinol SA (VETOPA)?
- Accurate Financial Data: Access reliable financials specific to Vetoquinol SA for trustworthy valuation outcomes.
- Customizable Features: Tailor essential parameters such as growth rates, WACC, and tax rates to align with your financial projections.
- Efficient: Built-in calculations provide a quick start, eliminating the hassle of doing everything from the ground up.
- Professional Tool: Engineered for investors, analysts, and consultants in the veterinary pharmaceutical field.
- User-Friendly Design: Clear layout and guided instructions ensure ease of use for everyone.
Who Can Benefit from This Product?
- Investors: Accurately assess the fair value of Vetoquinol SA (VETOPA) to inform investment choices.
- CFOs: Utilize a professional-grade DCF model for comprehensive financial analysis and reporting.
- Consultants: Easily customize the template to create valuation reports for your clients.
- Entrepreneurs: Discover financial modeling techniques employed by leading corporations.
- Educators: Employ it as a practical tool for teaching valuation concepts and methodologies.
Contents of the Template
- Pre-Filled DCF Model: Vetoquinol SA’s financial data preloaded for immediate analysis.
- WACC Calculator: In-depth calculations for Weighted Average Cost of Capital.
- Financial Ratios: Assess Vetoquinol SA’s profitability, leverage, and efficiency.
- Editable Inputs: Modify assumptions such as growth rates, margins, and CAPEX to match your scenarios.
- Financial Statements: Access annual and quarterly reports to facilitate comprehensive analysis.
- Interactive Dashboard: Easily visualize key valuation metrics and outcomes.
Disclaimer
All information, articles, and product details provided on this website are for general informational and educational purposes only. We do not claim any ownership over, nor do we intend to infringe upon, any trademarks, copyrights, logos, brand names, or other intellectual property mentioned or depicted on this site. Such intellectual property remains the property of its respective owners, and any references here are made solely for identification or informational purposes, without implying any affiliation, endorsement, or partnership.
We make no representations or warranties, express or implied, regarding the accuracy, completeness, or suitability of any content or products presented. Nothing on this website should be construed as legal, tax, investment, financial, medical, or other professional advice. In addition, no part of this site—including articles or product references—constitutes a solicitation, recommendation, endorsement, advertisement, or offer to buy or sell any securities, franchises, or other financial instruments, particularly in jurisdictions where such activity would be unlawful.
All content is of a general nature and may not address the specific circumstances of any individual or entity. It is not a substitute for professional advice or services. Any actions you take based on the information provided here are strictly at your own risk. You accept full responsibility for any decisions or outcomes arising from your use of this website and agree to release us from any liability in connection with your use of, or reliance upon, the content or products found herein.