
|
VisLink Technologies, Inc. (VISL) Valation DCF |
Entièrement Modifiable: Adapté À Vos Besoins Dans Excel Ou Sheets
Conception Professionnelle: Modèles Fiables Et Conformes Aux Normes Du Secteur
Pré-Construits Pour Une Utilisation Rapide Et Efficace
Compatible MAC/PC, entièrement débloqué
Aucune Expertise N'Est Requise; Facile À Suivre
Vislink Technologies, Inc. (VISL) Bundle
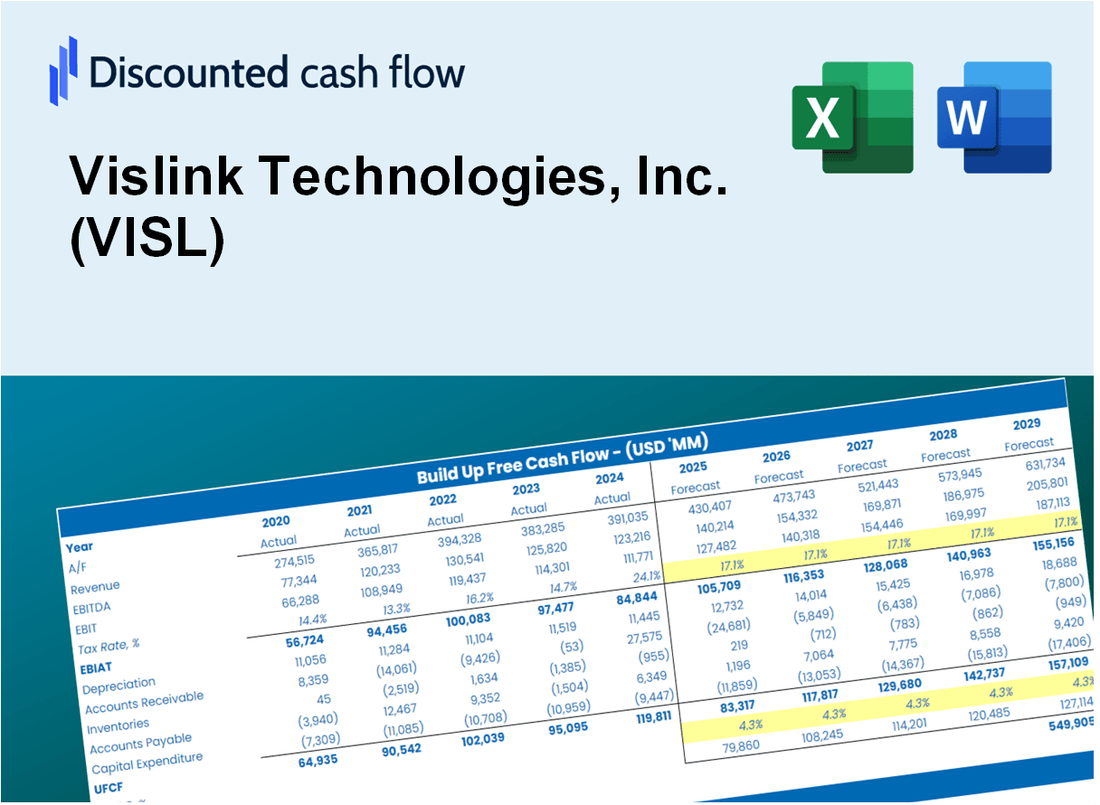
Simplifiez Vislink Technologies, Inc. (VISL) Évaluation avec cette calculatrice DCF personnalisable! Doté de Real Vislink Technologies, Inc. (VISL) Financials and Rajustement des intrants de prévision, vous pouvez tester des scénarios et découvrir Vislink Technologies, Inc. (VISL) la juste valeur en minutes.
What You Will Get
- Pre-Filled Financial Model: Vislink Technologies’ actual data allows for accurate DCF valuation.
- Full Forecast Control: Modify revenue growth, margins, WACC, and other essential drivers.
- Instant Calculations: Automatic updates provide immediate results as you adjust inputs.
- Investor-Ready Template: A polished Excel file crafted for high-quality valuation.
- Customizable and Reusable: Designed for flexibility, enabling repeated use for comprehensive forecasts.
Key Features
- Comprehensive Financial Data: Access Vislink Technologies' historical financial statements and pre-filled projections.
- Customizable Assumptions: Adjust WACC, tax rates, revenue growth, and EBITDA margins to fit your analysis.
- Real-Time Valuation: Witness the intrinsic value of Vislink Technologies recalculated instantly.
- Intuitive Visualizations: Dashboard charts provide clear displays of valuation outcomes and essential metrics.
- Designed for Precision: A reliable tool tailored for analysts, investors, and finance professionals.
How It Works
- Download: Obtain the pre-formatted Excel file containing Vislink Technologies, Inc.'s (VISL) financial data.
- Customize: Modify projections such as revenue growth, EBITDA %, and WACC to fit your analysis.
- Update Automatically: Watch as the intrinsic value and NPV calculations refresh in real-time.
- Test Scenarios: Develop various projections and evaluate outcomes without delay.
- Make Decisions: Leverage the valuation insights to inform your investment approach.
Why Choose Vislink Technologies, Inc. (VISL)?
- Enhance Efficiency: Streamlined processes mean you can focus on what matters most – your projects.
- Boost Reliability: Utilize cutting-edge technology that ensures high-quality transmission and reception.
- Fully Adaptable: Customize solutions to meet the unique needs of your business and clients.
- User-Friendly Interface: Intuitive designs make it easy to navigate and implement our technologies.
- Preferred by Industry Leaders: Our solutions are trusted by professionals who demand the best in performance and reliability.
Who Should Use This Product?
- Finance Students: Explore advanced communication technologies and their market applications.
- Researchers: Utilize real-world data to study trends in the broadcast and telecommunications sectors.
- Investors: Evaluate your investment strategies and analyze market performance for Vislink Technologies, Inc. (VISL).
- Industry Analysts: Enhance your analysis with a comprehensive overview of Vislink's innovative solutions.
- Business Executives: Understand how emerging technologies can impact company growth and market positioning.
What the Template Contains
- Preloaded VISL Data: Historical and projected financial data, including revenue, EBIT, and capital expenditures.
- DCF and WACC Models: Professional-grade sheets for calculating intrinsic value and Weighted Average Cost of Capital.
- Editable Inputs: Yellow-highlighted cells for adjusting revenue growth, tax rates, and discount rates.
- Financial Statements: Comprehensive annual and quarterly financials for deeper analysis.
- Key Ratios: Profitability, leverage, and efficiency ratios to evaluate performance.
- Dashboard and Charts: Visual summaries of valuation outcomes and assumptions.
Disclaimer
All information, articles, and product details provided on this website are for general informational and educational purposes only. We do not claim any ownership over, nor do we intend to infringe upon, any trademarks, copyrights, logos, brand names, or other intellectual property mentioned or depicted on this site. Such intellectual property remains the property of its respective owners, and any references here are made solely for identification or informational purposes, without implying any affiliation, endorsement, or partnership.
We make no representations or warranties, express or implied, regarding the accuracy, completeness, or suitability of any content or products presented. Nothing on this website should be construed as legal, tax, investment, financial, medical, or other professional advice. In addition, no part of this site—including articles or product references—constitutes a solicitation, recommendation, endorsement, advertisement, or offer to buy or sell any securities, franchises, or other financial instruments, particularly in jurisdictions where such activity would be unlawful.
All content is of a general nature and may not address the specific circumstances of any individual or entity. It is not a substitute for professional advice or services. Any actions you take based on the information provided here are strictly at your own risk. You accept full responsibility for any decisions or outcomes arising from your use of this website and agree to release us from any liability in connection with your use of, or reliance upon, the content or products found herein.