
|
Village Super Market, Inc. (VLGEA) Évaluation DCF |
Entièrement Modifiable: Adapté À Vos Besoins Dans Excel Ou Sheets
Conception Professionnelle: Modèles Fiables Et Conformes Aux Normes Du Secteur
Pré-Construits Pour Une Utilisation Rapide Et Efficace
Compatible MAC/PC, entièrement débloqué
Aucune Expertise N'Est Requise; Facile À Suivre
Village Super Market, Inc. (VLGEA) Bundle
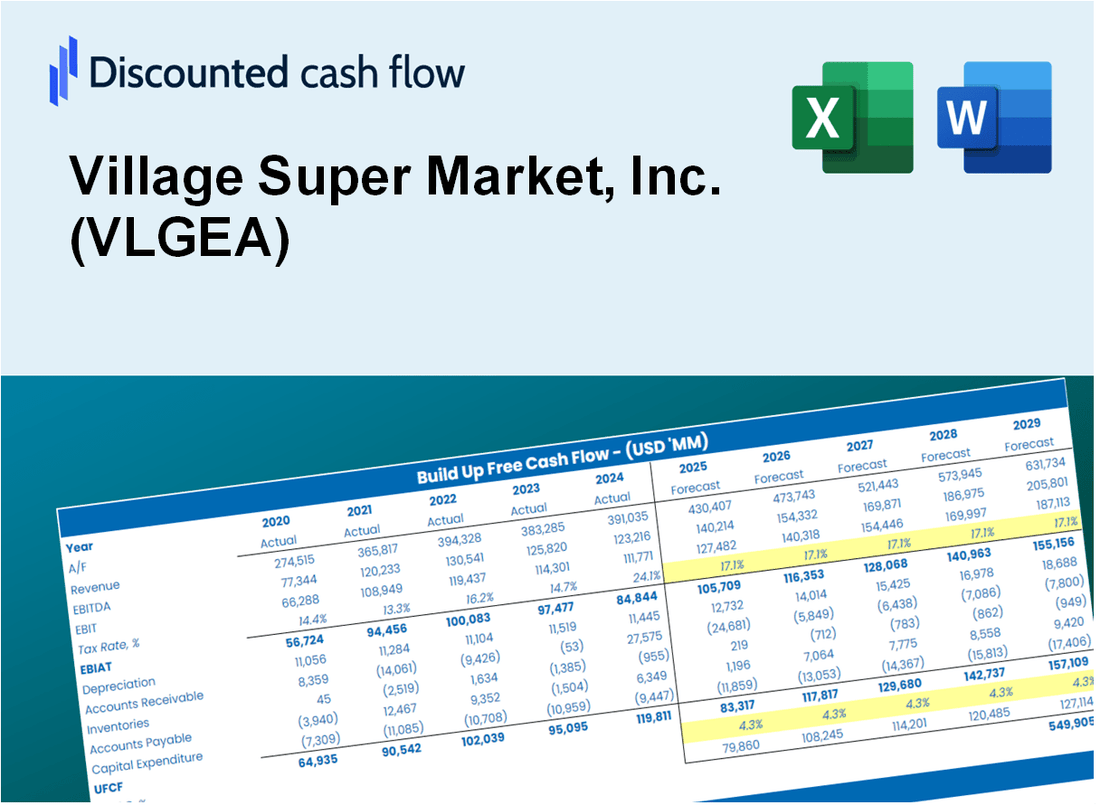
Gardez un aperçu de votre analyse d'évaluation de votre Village Super Market, Inc. (VLGEA) à l'aide de notre calculatrice sophistiquée DCF! Ce modèle Excel est préchargé avec des données réelles (VLGEA), vous permettant d'ajuster les prévisions et les hypothèses pour un calcul précis de la valeur intrinsèque de Village Super Market.
Discounted Cash Flow (DCF) - (USD MM)
| Year | AY1 2021 |
AY2 2022 |
AY3 2023 |
AY4 2024 |
AY5 2025 |
FY1 2026 |
FY2 2027 |
FY3 2028 |
FY4 2029 |
FY5 2030 |
|---|---|---|---|---|---|---|---|---|---|---|
| Revenue | 2,030.3 | 2,061.1 | 2,166.7 | 2,236.6 | 2,320.7 | 2,374.1 | 2,428.7 | 2,484.5 | 2,541.7 | 2,600.1 |
| Revenue Growth, % | 0 | 1.51 | 5.12 | 3.23 | 3.76 | 2.3 | 2.3 | 2.3 | 2.3 | 2.3 |
| EBITDA | 68.5 | 77.7 | 112.7 | 112.3 | 110.2 | 105.0 | 107.4 | 109.9 | 112.4 | 115.0 |
| EBITDA, % | 3.37 | 3.77 | 5.2 | 5.02 | 4.75 | 4.42 | 4.42 | 4.42 | 4.42 | 4.42 |
| Depreciation | 35.7 | 34.7 | 35.7 | 35.5 | 36.7 | 39.2 | 40.1 | 41.0 | 42.0 | 42.9 |
| Depreciation, % | 1.76 | 1.68 | 1.65 | 1.59 | 1.58 | 1.65 | 1.65 | 1.65 | 1.65 | 1.65 |
| EBIT | 32.8 | 43.0 | 76.9 | 76.9 | 73.5 | 65.8 | 67.3 | 68.9 | 70.4 | 72.1 |
| EBIT, % | 1.62 | 2.08 | 3.55 | 3.44 | 3.17 | 2.77 | 2.77 | 2.77 | 2.77 | 2.77 |
| Total Cash | 116.3 | 134.8 | 140.9 | 117.3 | 110.7 | 136.7 | 139.8 | 143.0 | 146.3 | 149.7 |
| Total Cash, percent | .0 | .0 | .0 | .0 | .0 | .0 | .0 | .0 | .0 | .0 |
| Account Receivables | 17.0 | 41.5 | 43.9 | 18.3 | 19.4 | 31.0 | 31.7 | 32.5 | 33.2 | 34.0 |
| Account Receivables, % | 0.83587 | 2.01 | 2.03 | 0.81911 | 0.83635 | 1.31 | 1.31 | 1.31 | 1.31 | 1.31 |
| Inventories | 42.6 | 44.2 | 44.5 | 46.7 | 51.4 | 50.3 | 51.5 | 52.7 | 53.9 | 55.1 |
| Inventories, % | 2.1 | 2.14 | 2.05 | 2.09 | 2.22 | 2.12 | 2.12 | 2.12 | 2.12 | 2.12 |
| Accounts Payable | 95.9 | 101.3 | 108.5 | 109.3 | 83.2 | 109.8 | 112.3 | 114.9 | 117.5 | 120.2 |
| Accounts Payable, % | 4.72 | 4.92 | 5.01 | 4.89 | 3.58 | 4.62 | 4.62 | 4.62 | 4.62 | 4.62 |
| Capital Expenditure | -25.2 | -43.3 | -46.4 | -63.1 | -58.8 | -51.5 | -52.6 | -53.9 | -55.1 | -56.4 |
| Capital Expenditure, % | -1.24 | -2.1 | -2.14 | -2.82 | -2.53 | -2.17 | -2.17 | -2.17 | -2.17 | -2.17 |
| Tax Rate, % | 31.09 | 31.09 | 31.09 | 31.09 | 31.09 | 31.09 | 31.09 | 31.09 | 31.09 | 31.09 |
| EBITAT | 22.7 | 29.5 | 52.6 | 53.3 | 50.7 | 45.3 | 46.4 | 47.5 | 48.5 | 49.7 |
| Depreciation | ||||||||||
| Changes in Account Receivables | ||||||||||
| Changes in Inventories | ||||||||||
| Changes in Accounts Payable | ||||||||||
| Capital Expenditure | ||||||||||
| UFCF | 69.5 | .3 | 46.3 | 49.9 | -3.3 | 49.2 | 34.5 | 35.3 | 36.1 | 36.9 |
| WACC, % | 4.72 | 4.71 | 4.7 | 4.72 | 4.71 | 4.71 | 4.71 | 4.71 | 4.71 | 4.71 |
| PV UFCF | ||||||||||
| SUM PV UFCF | 168.6 | |||||||||
| Long Term Growth Rate, % | 0.50 | |||||||||
| Free cash flow (T + 1) | 37 | |||||||||
| Terminal Value | 882 | |||||||||
| Present Terminal Value | 700 | |||||||||
| Enterprise Value | 869 | |||||||||
| Net Debt | 230 | |||||||||
| Equity Value | 639 | |||||||||
| Diluted Shares Outstanding, MM | 15 | |||||||||
| Equity Value Per Share | 43.30 |
What You Will Get
- Editable Forecast Inputs: Easily modify assumptions (growth %, margins, WACC) to generate various scenarios.
- Real-World Data: Village Super Market, Inc.'s (VLGEA) financial data pre-filled to kickstart your analysis.
- Automatic DCF Outputs: The template computes Net Present Value (NPV) and intrinsic value for you.
- Customizable and Professional: A refined Excel model that adjusts to your valuation requirements.
- Built for Analysts and Investors: Perfect for testing projections, validating strategies, and saving time.
Key Features
- Comprehensive DCF Calculator: Features detailed unlevered and levered DCF valuation models tailored for Village Super Market, Inc. (VLGEA).
- WACC Calculator: Includes a pre-built Weighted Average Cost of Capital sheet with adjustable inputs specific to the retail sector.
- Customizable Forecast Assumptions: Easily adjust growth rates, capital expenditures, and discount rates to fit Village Super Market's financial outlook.
- Integrated Financial Ratios: Evaluate profitability, leverage, and efficiency ratios for Village Super Market, Inc. (VLGEA).
- Interactive Dashboard and Charts: Visual representations summarize essential valuation metrics for straightforward analysis.
How It Works
- Download: Obtain the pre-formatted Excel file containing Village Super Market, Inc.'s (VLGEA) financial data.
- Customize: Modify projections, including sales growth, EBITDA margin, and discount rate.
- Update Automatically: The calculations for intrinsic value and NPV refresh in real-time.
- Test Scenarios: Develop various forecasts and analyze different outcomes instantly.
- Make Decisions: Leverage the valuation insights to inform your investment choices.
Why Choose Village Super Market, Inc. (VLGEA)?
- Convenient Shopping: Enjoy a wide selection of fresh produce and groceries all in one place.
- Commitment to Quality: We prioritize high-quality products to ensure customer satisfaction.
- Community Focused: Supporting local farmers and suppliers is at the heart of our business.
- Exceptional Service: Our friendly staff is dedicated to providing a pleasant shopping experience.
- Value for Money: Competitive pricing and regular promotions help you save on your grocery bills.
Who Should Use This Product?
- Investors: Accurately estimate Village Super Market, Inc.'s (VLGEA) fair value before making investment decisions.
- CFOs: Utilize a professional-grade DCF model for financial reporting and analysis specific to Village Super Market, Inc. (VLGEA).
- Consultants: Easily customize the template for valuation reports tailored to clients in the retail sector.
- Entrepreneurs: Gain insights into financial modeling techniques employed by leading grocery retailers.
- Educators: Use it as an instructional resource to illustrate valuation methodologies in the context of the supermarket industry.
What the Template Contains
- Preloaded VLGEA Data: Historical and projected financial data, including revenue, EBIT, and capital expenditures.
- DCF and WACC Models: Professional-grade sheets for calculating intrinsic value and Weighted Average Cost of Capital.
- Editable Inputs: Yellow-highlighted cells for adjusting revenue growth, tax rates, and discount rates.
- Financial Statements: Comprehensive annual and quarterly financials for deeper analysis.
- Key Ratios: Profitability, leverage, and efficiency ratios to evaluate performance.
- Dashboard and Charts: Visual summaries of valuation outcomes and assumptions.
Disclaimer
All information, articles, and product details provided on this website are for general informational and educational purposes only. We do not claim any ownership over, nor do we intend to infringe upon, any trademarks, copyrights, logos, brand names, or other intellectual property mentioned or depicted on this site. Such intellectual property remains the property of its respective owners, and any references here are made solely for identification or informational purposes, without implying any affiliation, endorsement, or partnership.
We make no representations or warranties, express or implied, regarding the accuracy, completeness, or suitability of any content or products presented. Nothing on this website should be construed as legal, tax, investment, financial, medical, or other professional advice. In addition, no part of this site—including articles or product references—constitutes a solicitation, recommendation, endorsement, advertisement, or offer to buy or sell any securities, franchises, or other financial instruments, particularly in jurisdictions where such activity would be unlawful.
All content is of a general nature and may not address the specific circumstances of any individual or entity. It is not a substitute for professional advice or services. Any actions you take based on the information provided here are strictly at your own risk. You accept full responsibility for any decisions or outcomes arising from your use of this website and agree to release us from any liability in connection with your use of, or reliance upon, the content or products found herein.