
|
Vodafone Group Public Limited Company (VOD) Évaluation DCF |
Entièrement Modifiable: Adapté À Vos Besoins Dans Excel Ou Sheets
Conception Professionnelle: Modèles Fiables Et Conformes Aux Normes Du Secteur
Pré-Construits Pour Une Utilisation Rapide Et Efficace
Compatible MAC/PC, entièrement débloqué
Aucune Expertise N'Est Requise; Facile À Suivre
Vodafone Group Public Limited Company (VOD) Bundle
En tant qu'investisseur ou analyste, cette calculatrice DCF de la Vodafone Group Public Limited Company (VOD) est votre ressource incontournable pour une évaluation précise. Avec les données réelles de Vodafone, vous pouvez ajuster les prévisions et observer instantanément les effets.
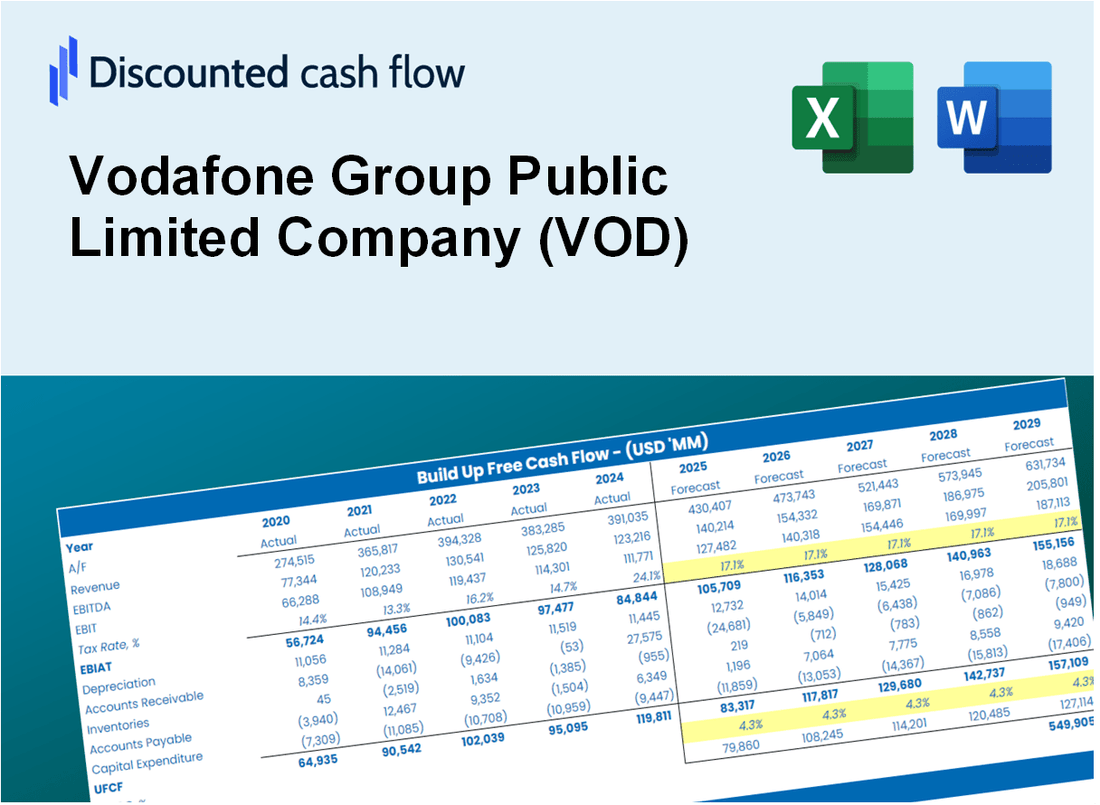
Discounted Cash Flow (DCF) - (USD MM)
| Year | AY1 2021 |
AY2 2022 |
AY3 2023 |
AY4 2024 |
AY5 2025 |
FY1 2026 |
FY2 2027 |
FY3 2028 |
FY4 2029 |
FY5 2030 |
|---|---|---|---|---|---|---|---|---|---|---|
| Revenue | 50,915.2 | 43,013.4 | 43,782.8 | 42,672.8 | 43,522.4 | 41,969.2 | 40,471.4 | 39,027.1 | 37,634.3 | 36,291.2 |
| Revenue Growth, % | 0 | -15.52 | 1.79 | -2.54 | 1.99 | -3.57 | -3.57 | -3.57 | -3.57 | -3.57 |
| EBITDA | 24,414.5 | 19,591.4 | 29,969.9 | 17,179.8 | 13,497.9 | 19,576.4 | 18,877.7 | 18,204.0 | 17,554.4 | 16,927.9 |
| EBITDA, % | 47.95 | 45.55 | 68.45 | 40.26 | 31.01 | 46.64 | 46.64 | 46.64 | 46.64 | 46.64 |
| Depreciation | 16,388.3 | 12,106.7 | 11,918.5 | 12,103.3 | 12,556.5 | 12,151.7 | 11,718.0 | 11,299.8 | 10,896.6 | 10,507.7 |
| Depreciation, % | 32.19 | 28.15 | 27.22 | 28.36 | 28.85 | 28.95 | 28.95 | 28.95 | 28.95 | 28.95 |
| EBIT | 8,026.2 | 7,484.6 | 18,051.4 | 5,076.5 | 941.4 | 7,424.7 | 7,159.7 | 6,904.2 | 6,657.8 | 6,420.2 |
| EBIT, % | 15.76 | 17.4 | 41.23 | 11.9 | 2.16 | 17.69 | 17.69 | 17.69 | 17.69 | 17.69 |
| Total Cash | 13,798.9 | 19,949.2 | 23,639.9 | 12,242.7 | 23,131.1 | 17,569.3 | 16,942.3 | 16,337.7 | 15,754.6 | 15,192.4 |
| Total Cash, percent | .0 | .0 | .0 | .0 | .0 | .0 | .0 | .0 | .0 | .0 |
| Account Receivables | 8,541.1 | 11,689.9 | 10,957.6 | 6,884.9 | 9,565.0 | 8,989.1 | 8,668.3 | 8,358.9 | 8,060.6 | 7,772.9 |
| Account Receivables, % | 16.78 | 27.18 | 25.03 | 16.13 | 21.98 | 21.42 | 21.42 | 21.42 | 21.42 | 21.42 |
| Inventories | 785.7 | 1,081.1 | 1,207.1 | 660.1 | 774.6 | 851.2 | 820.8 | 791.5 | 763.2 | 736.0 |
| Inventories, % | 1.54 | 2.51 | 2.76 | 1.55 | 1.78 | 2.03 | 2.03 | 2.03 | 2.03 | 2.03 |
| Accounts Payable | 7,832.1 | 25,424.3 | 23,040.2 | 6,925.6 | 17,655.0 | 15,437.0 | 14,886.1 | 14,354.9 | 13,842.6 | 13,348.6 |
| Accounts Payable, % | 15.38 | 59.11 | 52.62 | 16.23 | 40.57 | 36.78 | 36.78 | 36.78 | 36.78 | 36.78 |
| Capital Expenditure | -6,291.0 | -5,284.6 | -5,761.1 | -7,972.8 | -7,785.6 | -6,242.7 | -6,019.9 | -5,805.1 | -5,597.9 | -5,398.1 |
| Capital Expenditure, % | -12.36 | -12.29 | -13.16 | -18.68 | -17.89 | -14.87 | -14.87 | -14.87 | -14.87 | -14.87 |
| Tax Rate, % | -182.07 | -182.07 | -182.07 | -182.07 | -182.07 | -182.07 | -182.07 | -182.07 | -182.07 | -182.07 |
| EBITAT | 108.9 | 4,035.5 | 16,344.9 | 3,572.4 | 2,655.4 | 4,695.2 | 4,527.6 | 4,366.1 | 4,210.2 | 4,060.0 |
| Depreciation | ||||||||||
| Changes in Account Receivables | ||||||||||
| Changes in Inventories | ||||||||||
| Changes in Accounts Payable | ||||||||||
| Capital Expenditure | ||||||||||
| UFCF | 8,711.6 | 25,005.5 | 20,724.4 | -3,792.1 | 15,361.0 | 8,885.7 | 10,026.0 | 9,668.2 | 9,323.2 | 8,990.5 |
| WACC, % | 0.28152 | 2.28 | 3.67 | 2.91 | 4.03 | 2.63 | 2.63 | 2.63 | 2.63 | 2.63 |
| PV UFCF | ||||||||||
| SUM PV UFCF | 43,415.3 | |||||||||
| Long Term Growth Rate, % | 2.00 | |||||||||
| Free cash flow (T + 1) | 9,170 | |||||||||
| Terminal Value | 1,446,259 | |||||||||
| Present Terminal Value | 1,269,955 | |||||||||
| Enterprise Value | 1,313,370 | |||||||||
| Net Debt | 52,906 | |||||||||
| Equity Value | 1,260,464 | |||||||||
| Diluted Shares Outstanding, MM | 262 | |||||||||
| Equity Value Per Share | 4,810.20 |
What You Will Get
- Editable Excel Template: A fully customizable Excel-based DCF Calculator featuring pre-filled real VOD financials.
- Real-World Data: Historical data and forward-looking estimates (highlighted in the yellow cells).
- Forecast Flexibility: Adjust forecast assumptions such as revenue growth, EBITDA %, and WACC.
- Automatic Calculations: Instantly observe the effect of your inputs on Vodafone’s valuation.
- Professional Tool: Designed for investors, CFOs, consultants, and financial analysts.
- User-Friendly Design: Organized for clarity and ease of use, complete with step-by-step instructions.
Key Features
- Real-Life VOD Data: Pre-filled with Vodafone’s historical financials and future growth projections.
- Fully Customizable Inputs: Modify revenue growth rates, profit margins, WACC, tax rates, and capital expenditures.
- Dynamic Valuation Model: Automatic recalculations of Net Present Value (NPV) and intrinsic value based on your inputs.
- Scenario Testing: Develop various forecasting scenarios to explore different valuation results.
- User-Friendly Design: Intuitive, organized, and tailored for both professionals and newcomers.
How It Works
- Step 1: Download the Excel file.
- Step 2: Review Vodafone’s pre-filled financial data and forecasts.
- Step 3: Modify key inputs such as revenue growth, WACC, and tax rates (highlighted cells).
- Step 4: Observe the DCF model update in real-time as you adjust assumptions.
- Step 5: Analyze the outputs and utilize the results for investment decisions regarding Vodafone Group Public Limited Company (VOD).
Why Choose This Calculator?
- Comprehensive Tool: Features DCF, WACC, and financial ratio analyses tailored for Vodafone Group (VOD).
- Customizable Inputs: Modify yellow-highlighted cells to explore different financial scenarios for Vodafone Group (VOD).
- Detailed Insights: Automatically computes Vodafone Group's (VOD) intrinsic value and Net Present Value.
- Preloaded Data: Historical and forecasted data provide reliable starting points for analysis on Vodafone Group (VOD).
- Professional Quality: Perfect for financial analysts, investors, and business consultants focused on Vodafone Group (VOD).
Who Should Use This Product?
- Finance Students: Understand telecommunications valuation methods and apply them using real market data.
- Academics: Integrate industry-specific models into your courses or research projects.
- Investors: Validate your investment strategies and evaluate valuation scenarios for Vodafone Group Public Limited Company (VOD).
- Analysts: Enhance your analysis with a ready-to-use, customizable DCF model tailored for telecom companies.
- Small Business Owners: Discover how major telecom firms like Vodafone are assessed and valued in the market.
What the Template Contains
- Historical Data: Includes Vodafone’s past financials and baseline forecasts.
- DCF and Levered DCF Models: Detailed templates to calculate Vodafone’s intrinsic value.
- WACC Sheet: Pre-built calculations for Weighted Average Cost of Capital.
- Editable Inputs: Modify key drivers like growth rates, EBITDA %, and CAPEX assumptions.
- Quarterly and Annual Statements: A complete breakdown of Vodafone’s financials.
- Interactive Dashboard: Visualize valuation results and projections dynamically.
Disclaimer
All information, articles, and product details provided on this website are for general informational and educational purposes only. We do not claim any ownership over, nor do we intend to infringe upon, any trademarks, copyrights, logos, brand names, or other intellectual property mentioned or depicted on this site. Such intellectual property remains the property of its respective owners, and any references here are made solely for identification or informational purposes, without implying any affiliation, endorsement, or partnership.
We make no representations or warranties, express or implied, regarding the accuracy, completeness, or suitability of any content or products presented. Nothing on this website should be construed as legal, tax, investment, financial, medical, or other professional advice. In addition, no part of this site—including articles or product references—constitutes a solicitation, recommendation, endorsement, advertisement, or offer to buy or sell any securities, franchises, or other financial instruments, particularly in jurisdictions where such activity would be unlawful.
All content is of a general nature and may not address the specific circumstances of any individual or entity. It is not a substitute for professional advice or services. Any actions you take based on the information provided here are strictly at your own risk. You accept full responsibility for any decisions or outcomes arising from your use of this website and agree to release us from any liability in connection with your use of, or reliance upon, the content or products found herein.