
|
Verona Pharma PLC (VRNA) Valation DCF |
Entièrement Modifiable: Adapté À Vos Besoins Dans Excel Ou Sheets
Conception Professionnelle: Modèles Fiables Et Conformes Aux Normes Du Secteur
Pré-Construits Pour Une Utilisation Rapide Et Efficace
Compatible MAC/PC, entièrement débloqué
Aucune Expertise N'Est Requise; Facile À Suivre
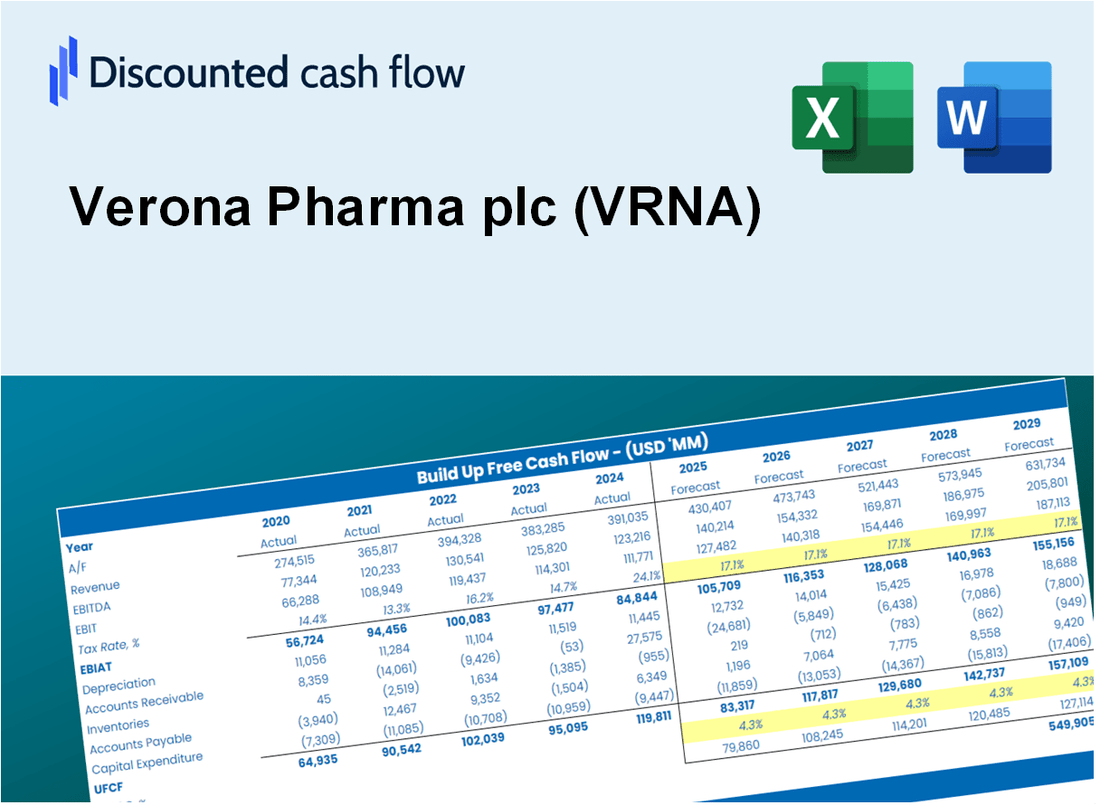
Verona Pharma plc (VRNA) Bundle
Rationalisez votre analyse et améliorez la précision avec notre calculatrice DCF (VRNA)! En utilisant des données réelles en pharma Vérone et des hypothèses personnalisables, cet outil vous permet de prévoir, évaluer et évaluer (AVRN) comme un investisseur chevronné.
Discounted Cash Flow (DCF) - (USD MM)
| Year | AY1 2020 |
AY2 2021 |
AY3 2022 |
AY4 2023 |
AY5 2024 |
FY1 2025 |
FY2 2026 |
FY3 2027 |
FY4 2028 |
FY5 2029 |
|---|---|---|---|---|---|---|---|---|---|---|
| Revenue | .0 | 39.8 | .5 | .0 | 45.4 | 22.9 | 11.5 | 5.8 | 2.9 | 1.5 |
| Revenue Growth, % | 0 | 0 | -98.72 | -100 | 0 | -49.68 | -49.68 | -49.68 | -49.68 | -49.68 |
| EBITDA | -64.3 | -56.8 | -72.9 | -69.4 | -161.2 | -4.6 | -2.3 | -1.2 | -.6 | -.3 |
| EBITDA, % | 100 | -142.63 | -14296.97 | 100 | -354.71 | -20 | -20 | -20 | -20 | -20 |
| Depreciation | .6 | .6 | .7 | .7 | 1.1 | 13.9 | 7.0 | 3.5 | 1.8 | .9 |
| Depreciation, % | 100 | 1.57 | 138.86 | 100 | 2.5 | 60.81 | 60.81 | 60.81 | 60.81 | 60.81 |
| EBIT | -64.9 | -57.4 | -73.6 | -70.1 | -162.3 | -4.6 | -2.3 | -1.2 | -.6 | -.3 |
| EBIT, % | 100 | -144.21 | -14435.84 | 100 | -357.22 | -20 | -20 | -20 | -20 | -20 |
| Total Cash | 252.9 | 199.6 | 306.5 | 365.6 | 537.8 | 22.9 | 11.5 | 5.8 | 2.9 | 1.5 |
| Total Cash, percent | .0 | .0 | .1 | .0 | .0 | .0 | .0 | .0 | .0 | .0 |
| Account Receivables | 11.1 | 21.0 | 12.5 | 14.7 | 50.1 | 20.7 | 10.4 | 5.2 | 2.6 | 1.3 |
| Account Receivables, % | 100 | 52.68 | 2449.94 | 100 | 110.33 | 90.54 | 90.54 | 90.54 | 90.54 | 90.54 |
| Inventories | 6.1 | 5.4 | 3.4 | .0 | 8.4 | 15.2 | 7.6 | 3.8 | 1.9 | 1.0 |
| Inventories, % | 100 | 13.65 | 659.6 | 100 | 18.5 | 66.43 | 66.43 | 66.43 | 66.43 | 66.43 |
| Accounts Payable | .2 | 13.5 | 3.9 | 4.7 | 15.2 | 16.8 | 8.5 | 4.3 | 2.1 | 1.1 |
| Accounts Payable, % | 100 | 33.96 | 768.08 | 100 | 33.36 | 73.46 | 73.46 | 73.46 | 73.46 | 73.46 |
| Capital Expenditure | -.1 | .0 | .0 | .0 | -.8 | -.4 | -.2 | -.1 | -.1 | .0 |
| Capital Expenditure, % | 100 | -0.0405696 | -7.65 | 100 | -1.72 | -1.88 | -1.88 | -1.88 | -1.88 | -1.88 |
| Tax Rate, % | -6.31 | -6.31 | -6.31 | -6.31 | -6.31 | -6.31 | -6.31 | -6.31 | -6.31 | -6.31 |
| EBITAT | -65.1 | -57.4 | -73.9 | -70.8 | -172.5 | -4.6 | -2.3 | -1.2 | -.6 | -.3 |
| Depreciation | ||||||||||
| Changes in Account Receivables | ||||||||||
| Changes in Inventories | ||||||||||
| Changes in Accounts Payable | ||||||||||
| Capital Expenditure | ||||||||||
| UFCF | -81.6 | -52.7 | -72.2 | -68.2 | -205.5 | 33.2 | 14.0 | 7.0 | 3.5 | 1.8 |
| WACC, % | 6.46 | 6.46 | 6.46 | 6.46 | 6.46 | 6.46 | 6.46 | 6.46 | 6.46 | 6.46 |
| PV UFCF | ||||||||||
| SUM PV UFCF | 53.4 | |||||||||
| Long Term Growth Rate, % | 2.00 | |||||||||
| Free cash flow (T + 1) | 2 | |||||||||
| Terminal Value | 41 | |||||||||
| Present Terminal Value | 30 | |||||||||
| Enterprise Value | 83 | |||||||||
| Net Debt | -373 | |||||||||
| Equity Value | 456 | |||||||||
| Diluted Shares Outstanding, MM | 10 | |||||||||
| Equity Value Per Share | 44.72 |
What You Will Receive
- Accurate VRNA Financial Data: Pre-loaded with Verona Pharma’s historical and forecasted data for detailed analysis.
- Customizable Template: Easily adjust key metrics such as revenue growth, WACC, and EBITDA %.
- Instant Calculations: Watch the intrinsic value of Verona Pharma update in real-time as you make changes.
- Expert Valuation Tool: Crafted for investors, analysts, and consultants aiming for precise DCF outcomes.
- Intuitive Design: Clear layout and straightforward instructions suitable for all skill levels.
Key Features
- Comprehensive DCF Calculator: Offers detailed unlevered and levered DCF valuation models tailored for Verona Pharma plc (VRNA).
- WACC Calculator: Includes a pre-configured Weighted Average Cost of Capital sheet with adjustable inputs for accurate financial analysis.
- Customizable Forecast Assumptions: Easily adjust growth rates, capital expenditures, and discount rates to fit your analysis needs.
- Integrated Financial Ratios: Evaluate profitability, leverage, and efficiency ratios specifically for Verona Pharma plc (VRNA).
- Interactive Dashboard and Charts: Visual representations provide a clear summary of key valuation metrics for straightforward analysis.
How It Works
- Download: Obtain the pre-configured Excel file containing Verona Pharma plc's (VRNA) financial data.
- Customize: Modify projections such as revenue growth, EBITDA %, and WACC according to your analysis.
- Update Automatically: The intrinsic value and NPV calculations refresh in real-time as you make adjustments.
- Test Scenarios: Generate various forecasts and instantly compare the results.
- Make Decisions: Leverage the valuation outputs to inform your investment choices.
Why Choose Verona Pharma plc (VRNA)?
- Innovative Solutions: Cutting-edge research and development in respiratory diseases.
- Proven Track Record: Successful clinical trials and a robust pipeline of therapies.
- Expert Team: A dedicated team of professionals committed to advancing healthcare.
- Strong Partnerships: Collaborations with leading institutions to enhance drug development.
- Commitment to Patients: Focused on improving the quality of life for those affected by respiratory conditions.
Who Should Use This Product?
- Investors: Accurately estimate Verona Pharma plc’s (VRNA) fair value before making investment decisions.
- CFOs: Utilize a professional-grade DCF model for financial reporting and analysis of Verona Pharma plc (VRNA).
- Consultants: Quickly adapt the template for valuation reports tailored for clients involving Verona Pharma plc (VRNA).
- Entrepreneurs: Gain insights into financial modeling practices employed by leading biotech firms like Verona Pharma plc (VRNA).
- Educators: Use it as a teaching tool to illustrate valuation methodologies relevant to companies such as Verona Pharma plc (VRNA).
What the Template Contains
- Pre-Filled Data: Includes Verona Pharma plc's historical financials and projections.
- Discounted Cash Flow Model: Editable DCF valuation model featuring automatic calculations.
- Weighted Average Cost of Capital (WACC): A dedicated sheet for calculating WACC based on user-defined inputs.
- Key Financial Ratios: Assess Verona Pharma plc's profitability, efficiency, and financial leverage.
- Customizable Inputs: Easily modify revenue growth, profit margins, and tax rates.
- Clear Dashboard: Visual representations and tables summarizing essential valuation outcomes.
Disclaimer
All information, articles, and product details provided on this website are for general informational and educational purposes only. We do not claim any ownership over, nor do we intend to infringe upon, any trademarks, copyrights, logos, brand names, or other intellectual property mentioned or depicted on this site. Such intellectual property remains the property of its respective owners, and any references here are made solely for identification or informational purposes, without implying any affiliation, endorsement, or partnership.
We make no representations or warranties, express or implied, regarding the accuracy, completeness, or suitability of any content or products presented. Nothing on this website should be construed as legal, tax, investment, financial, medical, or other professional advice. In addition, no part of this site—including articles or product references—constitutes a solicitation, recommendation, endorsement, advertisement, or offer to buy or sell any securities, franchises, or other financial instruments, particularly in jurisdictions where such activity would be unlawful.
All content is of a general nature and may not address the specific circumstances of any individual or entity. It is not a substitute for professional advice or services. Any actions you take based on the information provided here are strictly at your own risk. You accept full responsibility for any decisions or outcomes arising from your use of this website and agree to release us from any liability in connection with your use of, or reliance upon, the content or products found herein.