
|
VISTRA CORP. (VST) Évaluation DCF |
Entièrement Modifiable: Adapté À Vos Besoins Dans Excel Ou Sheets
Conception Professionnelle: Modèles Fiables Et Conformes Aux Normes Du Secteur
Pré-Construits Pour Une Utilisation Rapide Et Efficace
Compatible MAC/PC, entièrement débloqué
Aucune Expertise N'Est Requise; Facile À Suivre
Vistra Corp. (VST) Bundle
Évaluez les perspectives financières de Vistra Corp. comme un expert! Ce (VST) Calculator DCF fournit des données financières pré-remplies et vous permet de compléter la flexibilité pour modifier la croissance des revenus, le WACC, les marges et d'autres hypothèses essentielles pour s'aligner sur vos projections.
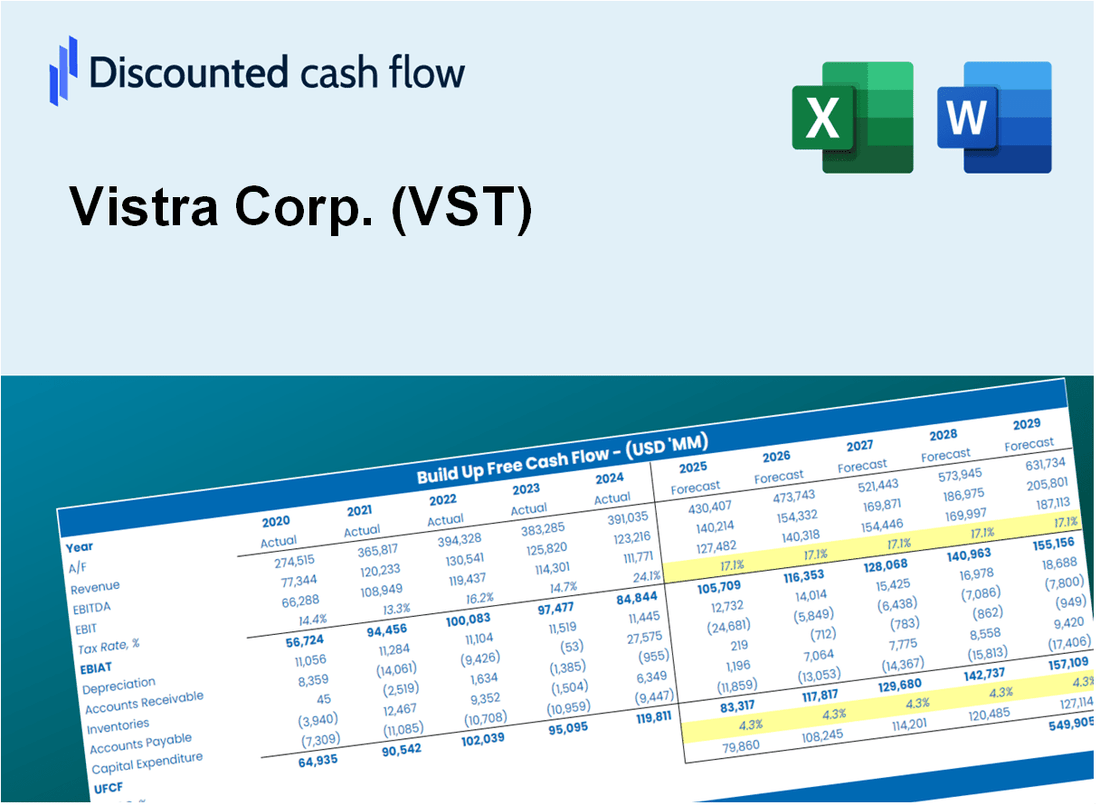
Discounted Cash Flow (DCF) - (USD MM)
| Year | AY1 2020 |
AY2 2021 |
AY3 2022 |
AY4 2023 |
AY5 2024 |
FY1 2025 |
FY2 2026 |
FY3 2027 |
FY4 2028 |
FY5 2029 |
|---|---|---|---|---|---|---|---|---|---|---|
| Revenue | 11,062.0 | 13,333.0 | 17,837.0 | 15,543.0 | 19,377.0 | 22,579.9 | 26,312.1 | 30,661.3 | 35,729.4 | 41,635.1 |
| Revenue Growth, % | 0 | 20.53 | 33.78 | -12.86 | 24.67 | 16.53 | 16.53 | 16.53 | 16.53 | 16.53 |
| EBITDA | 3,163.0 | 852.0 | 1,287.0 | 4,616.0 | 7,192.0 | 4,923.0 | 5,736.7 | 6,685.0 | 7,790.0 | 9,077.6 |
| EBITDA, % | 28.59 | 6.39 | 7.22 | 29.7 | 37.12 | 21.8 | 21.8 | 21.8 | 21.8 | 21.8 |
| Depreciation | 1,977.0 | 1,976.0 | 1,994.0 | 1,867.0 | 2,631.0 | 3,136.8 | 3,655.3 | 4,259.5 | 4,963.6 | 5,784.1 |
| Depreciation, % | 17.87 | 14.82 | 11.18 | 12.01 | 13.58 | 13.89 | 13.89 | 13.89 | 13.89 | 13.89 |
| EBIT | 1,186.0 | -1,124.0 | -707.0 | 2,749.0 | 4,561.0 | 1,786.2 | 2,081.4 | 2,425.4 | 2,826.3 | 3,293.5 |
| EBIT, % | 10.72 | -8.43 | -3.96 | 17.69 | 23.54 | 7.91 | 7.91 | 7.91 | 7.91 | 7.91 |
| Total Cash | 406.0 | 1,325.0 | 455.0 | 3,485.0 | 1,188.0 | 2,019.2 | 2,352.9 | 2,741.8 | 3,195.0 | 3,723.1 |
| Total Cash, percent | .0 | .0 | .0 | .0 | .0 | .0 | .0 | .0 | .0 | .0 |
| Account Receivables | 1,279.0 | 1,956.0 | 2,086.0 | 1,680.0 | 1,990.0 | 2,664.7 | 3,105.1 | 3,618.4 | 4,216.5 | 4,913.4 |
| Account Receivables, % | 11.56 | 14.67 | 11.69 | 10.81 | 10.27 | 11.8 | 11.8 | 11.8 | 11.8 | 11.8 |
| Inventories | 515.0 | 610.0 | 570.0 | 740.0 | 970.0 | 1,002.2 | 1,167.9 | 1,360.9 | 1,585.9 | 1,848.0 |
| Inventories, % | 4.66 | 4.58 | 3.2 | 4.76 | 5.01 | 4.44 | 4.44 | 4.44 | 4.44 | 4.44 |
| Accounts Payable | 880.0 | 1,515.0 | 1,556.0 | 1,147.0 | 1,510.0 | 1,951.5 | 2,274.1 | 2,650.0 | 3,088.0 | 3,598.4 |
| Accounts Payable, % | 7.96 | 11.36 | 8.72 | 7.38 | 7.79 | 8.64 | 8.64 | 8.64 | 8.64 | 8.64 |
| Capital Expenditure | -1,259.0 | -1,033.0 | -1,301.0 | -1,676.0 | -2,078.0 | -2,164.5 | -2,522.3 | -2,939.2 | -3,425.0 | -3,991.1 |
| Capital Expenditure, % | -11.38 | -7.75 | -7.29 | -10.78 | -10.72 | -9.59 | -9.59 | -9.59 | -9.59 | -9.59 |
| Tax Rate, % | 23.31 | 23.31 | 23.31 | 23.31 | 23.31 | 23.31 | 23.31 | 23.31 | 23.31 | 23.31 |
| EBITAT | 847.5 | -831.6 | -556.1 | 2,052.1 | 3,498.0 | 1,341.2 | 1,562.9 | 1,821.2 | 2,122.3 | 2,473.1 |
| Depreciation | ||||||||||
| Changes in Account Receivables | ||||||||||
| Changes in Inventories | ||||||||||
| Changes in Accounts Payable | ||||||||||
| Capital Expenditure | ||||||||||
| UFCF | 651.5 | -25.6 | 87.9 | 2,070.1 | 3,874.0 | 2,048.1 | 2,412.4 | 2,811.2 | 3,275.8 | 3,817.3 |
| WACC, % | 8.89 | 8.92 | 8.98 | 8.93 | 8.96 | 8.94 | 8.94 | 8.94 | 8.94 | 8.94 |
| PV UFCF | ||||||||||
| SUM PV UFCF | 10,902.3 | |||||||||
| Long Term Growth Rate, % | 2.00 | |||||||||
| Free cash flow (T + 1) | 3,894 | |||||||||
| Terminal Value | 56,144 | |||||||||
| Present Terminal Value | 36,598 | |||||||||
| Enterprise Value | 47,500 | |||||||||
| Net Debt | 16,176 | |||||||||
| Equity Value | 31,324 | |||||||||
| Diluted Shares Outstanding, MM | 353 | |||||||||
| Equity Value Per Share | 88.85 |
What You Will Get
- Pre-Filled Financial Model: Vistra Corp.’s actual data enables precise DCF valuation.
- Full Forecast Control: Adjust revenue growth, margins, WACC, and other key drivers.
- Instant Calculations: Automatic updates ensure you see results as you make changes.
- Investor-Ready Template: A refined Excel file designed for professional-grade valuation.
- Customizable and Reusable: Tailored for flexibility, allowing repeated use for detailed forecasts.
Key Features
- 🔍 Real-Life VST Financials: Pre-filled historical and projected data for Vistra Corp. (VST).
- ✏️ Fully Customizable Inputs: Adjust all critical parameters (yellow cells) like WACC, growth %, and tax rates.
- 📊 Professional DCF Valuation: Built-in formulas calculate Vistra’s intrinsic value using the Discounted Cash Flow method.
- ⚡ Instant Results: Visualize Vistra’s valuation instantly after making changes.
- Scenario Analysis: Test and compare outcomes for various financial assumptions side-by-side.
How It Works
- Step 1: Download the Excel file.
- Step 2: Review pre-entered Vistra Corp. (VST) data (historical and projected).
- Step 3: Adjust key assumptions (yellow cells) based on your analysis.
- Step 4: View automatic recalculations for Vistra Corp.'s (VST) intrinsic value.
- Step 5: Use the outputs for investment decisions or reporting.
Why Choose Vistra Corp. (VST)?
- Time Efficiency: Skip the hassle of building models from the ground up – our tools are ready for immediate use.
- Enhanced Accuracy: Dependable data and methodologies minimize valuation errors.
- Completely Customizable: Adjust the framework to suit your specific forecasts and assumptions.
- User-Friendly: Intuitive visuals and outputs simplify result interpretation.
- Endorsed by Professionals: Crafted for industry experts who prioritize both precision and functionality.
Who Should Use This Product?
- Institutional Investors: Develop comprehensive and accurate valuation models for portfolio management.
- Energy Sector Analysts: Evaluate valuation scenarios to inform strategic decisions within the energy market.
- Financial Consultants: Offer clients precise valuation assessments for Vistra Corp. (VST) stock.
- Students and Instructors: Utilize real-time data to enhance learning and practice in financial modeling.
- Energy Industry Enthusiasts: Gain insights into how companies like Vistra Corp. (VST) are valued in the energy sector.
What the Template Contains
- Historical Data: Includes Vistra Corp.'s (VST) past financials and baseline forecasts.
- DCF and Levered DCF Models: Detailed templates to calculate Vistra Corp.'s (VST) intrinsic value.
- WACC Sheet: Pre-built calculations for Weighted Average Cost of Capital.
- Editable Inputs: Modify key drivers like growth rates, EBITDA %, and CAPEX assumptions.
- Quarterly and Annual Statements: A complete breakdown of Vistra Corp.'s (VST) financials.
- Interactive Dashboard: Visualize valuation results and projections dynamically.
Disclaimer
All information, articles, and product details provided on this website are for general informational and educational purposes only. We do not claim any ownership over, nor do we intend to infringe upon, any trademarks, copyrights, logos, brand names, or other intellectual property mentioned or depicted on this site. Such intellectual property remains the property of its respective owners, and any references here are made solely for identification or informational purposes, without implying any affiliation, endorsement, or partnership.
We make no representations or warranties, express or implied, regarding the accuracy, completeness, or suitability of any content or products presented. Nothing on this website should be construed as legal, tax, investment, financial, medical, or other professional advice. In addition, no part of this site—including articles or product references—constitutes a solicitation, recommendation, endorsement, advertisement, or offer to buy or sell any securities, franchises, or other financial instruments, particularly in jurisdictions where such activity would be unlawful.
All content is of a general nature and may not address the specific circumstances of any individual or entity. It is not a substitute for professional advice or services. Any actions you take based on the information provided here are strictly at your own risk. You accept full responsibility for any decisions or outcomes arising from your use of this website and agree to release us from any liability in connection with your use of, or reliance upon, the content or products found herein.