
|
VISTRY GROUP PLC (VTY.L) Évaluation DCF |
Entièrement Modifiable: Adapté À Vos Besoins Dans Excel Ou Sheets
Conception Professionnelle: Modèles Fiables Et Conformes Aux Normes Du Secteur
Pré-Construits Pour Une Utilisation Rapide Et Efficace
Compatible MAC/PC, entièrement débloqué
Aucune Expertise N'Est Requise; Facile À Suivre
Vistry Group PLC (VTY.L) Bundle
Évaluez les perspectives financières de Vistry Group PLC avec expertise! Ce calculatrice DCF (VTYL) vous fournit des données financières pré-remplies et la flexibilité pour modifier la croissance des revenus, le WACC, les marges bénéficiaires et d'autres hypothèses essentielles pour s'aligner sur vos projections.
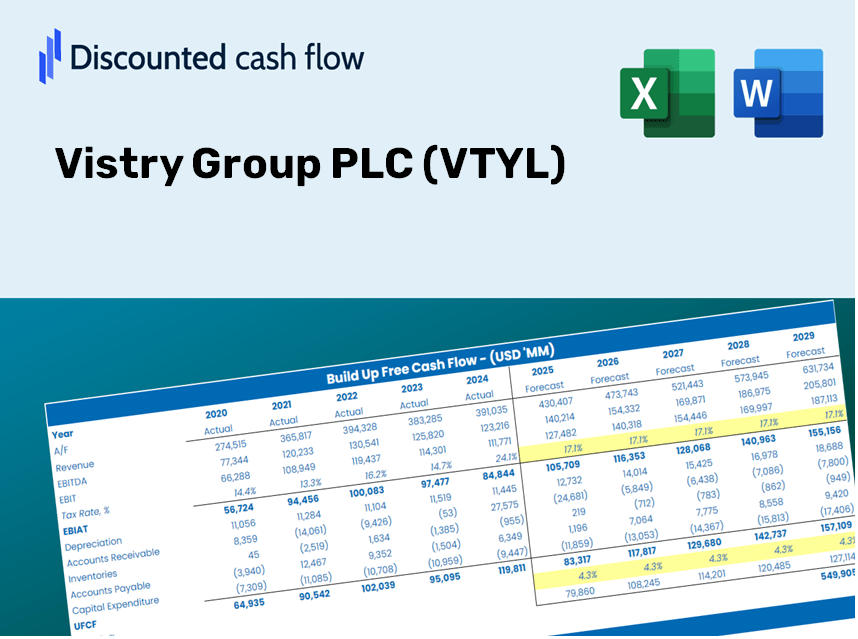
Discounted Cash Flow (DCF) - (USD MM)
| Year | AY1 2020 |
AY2 2021 |
AY3 2022 |
AY4 2023 |
AY5 2024 |
FY1 2025 |
FY2 2026 |
FY3 2027 |
FY4 2028 |
FY5 2029 |
|---|---|---|---|---|---|---|---|---|---|---|
| Revenue | 1,811.7 | 2,407.2 | 2,771.3 | 3,564.2 | 3,779.3 | 3,924.5 | 4,075.3 | 4,231.9 | 4,394.5 | 4,563.3 |
| Revenue Growth, % | 0 | 32.87 | 15.13 | 28.61 | 6.04 | 3.84 | 3.84 | 3.84 | 3.84 | 3.84 |
| EBITDA | 141.7 | 341.0 | 248.5 | 415.3 | 213.9 | 378.8 | 393.4 | 408.5 | 424.2 | 440.5 |
| EBITDA, % | 7.82 | 14.17 | 8.97 | 11.65 | 5.66 | 9.65 | 9.65 | 9.65 | 9.65 | 9.65 |
| Depreciation | 31.7 | 32.5 | 35.2 | 74.1 | 73.9 | 66.0 | 68.5 | 71.1 | 73.9 | 76.7 |
| Depreciation, % | 1.75 | 1.35 | 1.27 | 2.08 | 1.96 | 1.68 | 1.68 | 1.68 | 1.68 | 1.68 |
| EBIT | 110.0 | 308.5 | 213.3 | 341.2 | 140.0 | 312.8 | 324.9 | 337.3 | 350.3 | 363.8 |
| EBIT, % | 6.07 | 12.81 | 7.7 | 9.57 | 3.7 | 7.97 | 7.97 | 7.97 | 7.97 | 7.97 |
| Total Cash | 341.0 | 398.7 | 676.8 | 418.3 | 320.3 | 628.1 | 652.2 | 677.2 | 703.3 | 730.3 |
| Total Cash, percent | .0 | .0 | .0 | .0 | .0 | .0 | .0 | .0 | .0 | .0 |
| Account Receivables | 154.2 | 182.8 | 542.1 | 406.5 | 736.1 | 522.3 | 542.4 | 563.2 | 584.9 | 607.4 |
| Account Receivables, % | 8.51 | 7.59 | 19.56 | 11.41 | 19.48 | 13.31 | 13.31 | 13.31 | 13.31 | 13.31 |
| Inventories | 1,836.5 | 1,962.2 | 2,838.1 | 3,100.7 | 3,008.3 | 3,517.2 | 3,652.3 | 3,792.7 | 3,938.4 | 4,089.7 |
| Inventories, % | 101.37 | 81.51 | 102.41 | 87 | 79.6 | 89.62 | 89.62 | 89.62 | 89.62 | 89.62 |
| Accounts Payable | 447.7 | 483.6 | 738.4 | 751.0 | 334.0 | 795.5 | 826.1 | 857.8 | 890.8 | 925.0 |
| Accounts Payable, % | 24.71 | 20.09 | 26.64 | 21.07 | 8.84 | 20.27 | 20.27 | 20.27 | 20.27 | 20.27 |
| Capital Expenditure | -2.7 | -3.1 | -1.6 | -2.8 | -6.9 | -4.7 | -4.9 | -5.1 | -5.3 | -5.5 |
| Capital Expenditure, % | -0.15129 | -0.1272 | -0.05773464 | -0.078559 | -0.18257 | -0.11947 | -0.11947 | -0.11947 | -0.11947 | -0.11947 |
| Tax Rate, % | 28.98 | 28.98 | 28.98 | 28.98 | 28.98 | 28.98 | 28.98 | 28.98 | 28.98 | 28.98 |
| EBITAT | 85.6 | 245.3 | 176.1 | 250.1 | 99.4 | 240.4 | 249.7 | 259.2 | 269.2 | 279.6 |
| Depreciation | ||||||||||
| Changes in Account Receivables | ||||||||||
| Changes in Inventories | ||||||||||
| Changes in Accounts Payable | ||||||||||
| Capital Expenditure | ||||||||||
| UFCF | -1,428.5 | 156.5 | -770.8 | 207.0 | -487.8 | 468.1 | 188.7 | 195.9 | 203.4 | 211.3 |
| WACC, % | 11.91 | 11.97 | 12.07 | 11.77 | 11.69 | 11.88 | 11.88 | 11.88 | 11.88 | 11.88 |
| PV UFCF | ||||||||||
| SUM PV UFCF | 959.3 | |||||||||
| Long Term Growth Rate, % | 2.00 | |||||||||
| Free cash flow (T + 1) | 215 | |||||||||
| Terminal Value | 2,181 | |||||||||
| Present Terminal Value | 1,244 | |||||||||
| Enterprise Value | 2,203 | |||||||||
| Net Debt | 277 | |||||||||
| Equity Value | 1,926 | |||||||||
| Diluted Shares Outstanding, MM | 342 | |||||||||
| Equity Value Per Share | 563.54 |
Benefits of Choosing Vistry Group PLC
- Authentic VTYL Financial Data: Access comprehensive historical and forecasted information for precise valuation.
- Customizable Parameters: Adjust WACC, tax rates, revenue growth, and capital expenditures to fit your analysis.
- Automated Calculations: Intrinsic value and NPV are instantly computed for your convenience.
- Scenario Testing: Explore various scenarios to assess Vistry Group’s prospective performance.
- User-Friendly Interface: Designed for industry experts, yet approachable for newcomers.
Key Features
- Pre-Loaded Data: Vistry Group PLC’s historical financial statements and pre-filled forecasts.
- Fully Adjustable Inputs: Customize WACC, tax rates, revenue growth, and EBITDA margins.
- Instant Results: Watch Vistry Group PLC’s intrinsic value recalculate in real time.
- Clear Visual Outputs: Dashboard charts illustrate valuation results and essential metrics.
- Built for Accuracy: A professional-grade tool designed for analysts, investors, and finance professionals.
How It Operates
- Download the Template: Gain immediate access to the Excel-based Vistry Group PLC DCF Calculator.
- Enter Your Assumptions: Modify the yellow-highlighted cells for growth rates, WACC, margins, and additional parameters.
- Instant Calculations: The model will automatically refresh Vistry Group PLC’s intrinsic value.
- Explore Scenarios: Test various assumptions to analyze potential changes in valuation.
- Evaluate and Decide: Utilize the outcomes to inform your investment or financial assessments.
Why Opt for This Calculator?
- Designed for Experts: A sophisticated tool utilized by analysts, CFOs, and consultants.
- Accurate Data: Vistry Group PLC’s historical and forecasted financials are preloaded for precision.
- Flexible Scenario Analysis: Easily simulate various projections and assumptions.
- Transparent Results: Automatically computes intrinsic value, NPV, and essential metrics.
- User-Friendly: Step-by-step guidance simplifies the entire process.
Who Can Benefit from This Product?
- Professional Investors: Create comprehensive and reliable valuation models for portfolio assessment.
- Corporate Finance Teams: Evaluate valuation scenarios to inform strategic decisions.
- Consultants and Advisors: Deliver precise valuation insights for Vistry Group PLC (VTYL) to clients.
- Students and Educators: Utilize real-world data to enhance financial modeling skills and education.
- Construction Industry Enthusiasts: Gain insights into how companies like Vistry Group PLC (VTYL) are valued within the marketplace.
Contents of the Template
- Historical Data: Provides Vistry Group PLC's (VTYL) previous financial performance and foundational forecasts.
- DCF and Levered DCF Models: Comprehensive templates to assess Vistry Group PLC's (VTYL) intrinsic value.
- WACC Sheet: Pre-configured calculations for the Weighted Average Cost of Capital.
- Editable Inputs: Adjust critical drivers such as growth rates, EBITDA margins, and CAPEX outlooks.
- Quarterly and Annual Statements: An extensive breakdown of Vistry Group PLC's (VTYL) financial data.
- Interactive Dashboard: Dynamically visualize valuation outcomes and future projections.
Disclaimer
All information, articles, and product details provided on this website are for general informational and educational purposes only. We do not claim any ownership over, nor do we intend to infringe upon, any trademarks, copyrights, logos, brand names, or other intellectual property mentioned or depicted on this site. Such intellectual property remains the property of its respective owners, and any references here are made solely for identification or informational purposes, without implying any affiliation, endorsement, or partnership.
We make no representations or warranties, express or implied, regarding the accuracy, completeness, or suitability of any content or products presented. Nothing on this website should be construed as legal, tax, investment, financial, medical, or other professional advice. In addition, no part of this site—including articles or product references—constitutes a solicitation, recommendation, endorsement, advertisement, or offer to buy or sell any securities, franchises, or other financial instruments, particularly in jurisdictions where such activity would be unlawful.
All content is of a general nature and may not address the specific circumstances of any individual or entity. It is not a substitute for professional advice or services. Any actions you take based on the information provided here are strictly at your own risk. You accept full responsibility for any decisions or outcomes arising from your use of this website and agree to release us from any liability in connection with your use of, or reliance upon, the content or products found herein.