
|
Windtree Therapeutics, Inc. (Wint) Valation DCF |
Entièrement Modifiable: Adapté À Vos Besoins Dans Excel Ou Sheets
Conception Professionnelle: Modèles Fiables Et Conformes Aux Normes Du Secteur
Pré-Construits Pour Une Utilisation Rapide Et Efficace
Compatible MAC/PC, entièrement débloqué
Aucune Expertise N'Est Requise; Facile À Suivre
Windtree Therapeutics, Inc. (WINT) Bundle
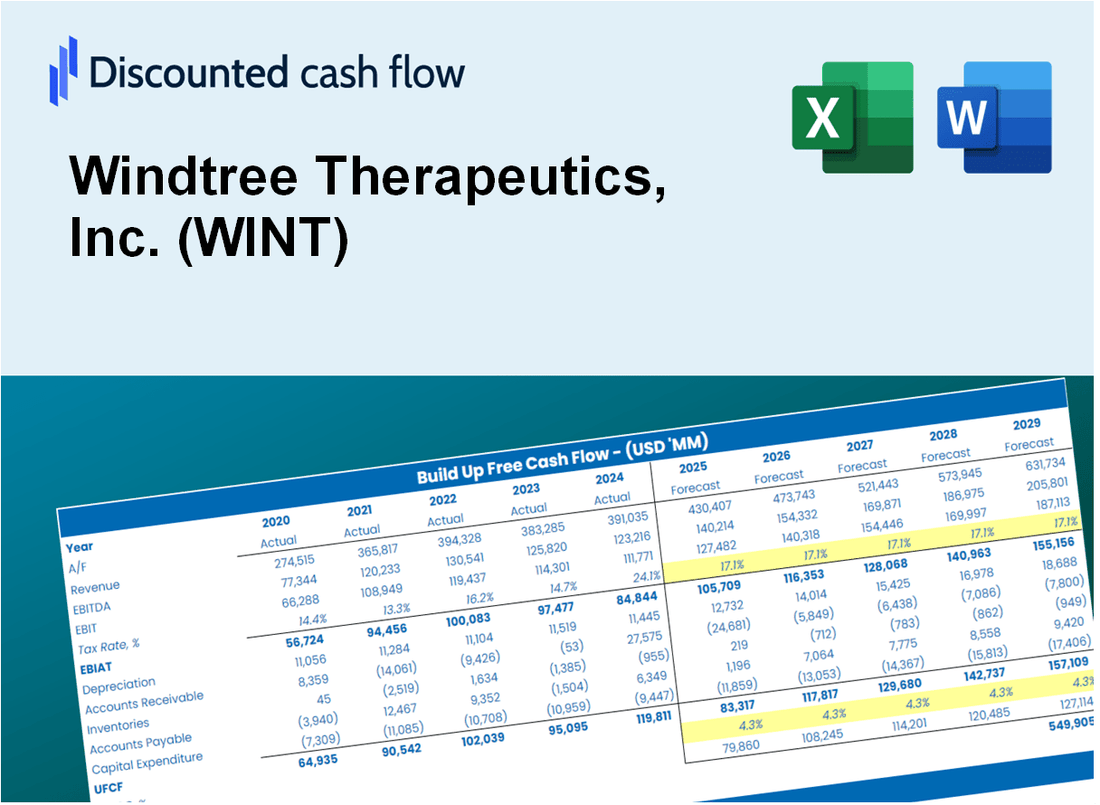
Conçu pour la précision, notre calculatrice DCF Windtree Therapeutics, Inc. (WINT) vous permet d'évaluer la valorisation de Windtree Therapeutics à l'aide de données financières réelles et offre une flexibilité complète pour modifier tous les paramètres essentiels pour des projections améliorées.
What You Will Receive
- Accurate WINT Financial Data: Pre-filled with Windtree Therapeutics’ historical and projected data for thorough analysis.
- Completely Customizable Template: Easily adjust key inputs such as revenue growth, WACC, and EBITDA %.
- Instant Calculations: Watch WINT's intrinsic value update in real-time as you make changes.
- Expert Valuation Tool: Tailored for investors, analysts, and consultants aiming for precise DCF results.
- Intuitive Design: User-friendly layout and straightforward instructions suitable for all skill levels.
Key Features
- Real-Life WINT Data: Pre-filled with Windtree Therapeutics' historical financials and forward-looking projections.
- Fully Customizable Inputs: Adjust revenue growth, margins, WACC, tax rates, and capital expenditures.
- Dynamic Valuation Model: Automatic updates to Net Present Value (NPV) and intrinsic value based on your inputs.
- Scenario Testing: Create multiple forecast scenarios to analyze different valuation outcomes.
- User-Friendly Design: Simple, structured, and designed for professionals and beginners alike.
How It Works
- Step 1: Download the Excel file.
- Step 2: Review Windtree Therapeutics, Inc.'s (WINT) pre-filled financial data and forecasts.
- Step 3: Modify key inputs such as revenue growth, WACC, and tax rates (highlighted cells).
- Step 4: Observe the DCF model update in real-time as you adjust your assumptions.
- Step 5: Evaluate the outputs and leverage the findings for your investment decisions.
Why Choose This Calculator for Windtree Therapeutics, Inc. (WINT)?
- Accuracy: Utilizes real Windtree Therapeutics financial data for precise calculations.
- Flexibility: Allows users to easily adjust and test various input parameters.
- Time-Saving: Eliminate the need to create a discounted cash flow model from the ground up.
- Professional-Grade: Crafted with the expertise and rigor expected at the CFO level.
- User-Friendly: Intuitive interface designed for users of all financial backgrounds.
Who Should Use Windtree Therapeutics, Inc. (WINT)?
- Investors: Gain insights into innovative therapies and make informed investment decisions.
- Healthcare Analysts: Utilize comprehensive data to evaluate the potential of Windtree's pipeline products.
- Consultants: Easily tailor presentations and reports to highlight Windtree’s advancements in respiratory therapeutics.
- Biotech Enthusiasts: Enhance your knowledge of cutting-edge treatments and their market implications.
- Educators and Students: Leverage real-world case studies from Windtree to enrich learning in biotechnology and healthcare courses.
What the Template Contains
- Pre-Filled Data: Includes Windtree Therapeutics, Inc.'s historical financials and projections.
- Discounted Cash Flow Model: Editable DCF valuation model with automatic calculations tailored for (WINT).
- Weighted Average Cost of Capital (WACC): A dedicated sheet for calculating WACC based on custom inputs specific to (WINT).
- Key Financial Ratios: Analyze Windtree Therapeutics' profitability, efficiency, and leverage metrics.
- Customizable Inputs: Edit revenue growth, margins, and tax rates with ease for (WINT).
- Clear Dashboard: Visual representations and tables summarizing key valuation results for (WINT).
Disclaimer
All information, articles, and product details provided on this website are for general informational and educational purposes only. We do not claim any ownership over, nor do we intend to infringe upon, any trademarks, copyrights, logos, brand names, or other intellectual property mentioned or depicted on this site. Such intellectual property remains the property of its respective owners, and any references here are made solely for identification or informational purposes, without implying any affiliation, endorsement, or partnership.
We make no representations or warranties, express or implied, regarding the accuracy, completeness, or suitability of any content or products presented. Nothing on this website should be construed as legal, tax, investment, financial, medical, or other professional advice. In addition, no part of this site—including articles or product references—constitutes a solicitation, recommendation, endorsement, advertisement, or offer to buy or sell any securities, franchises, or other financial instruments, particularly in jurisdictions where such activity would be unlawful.
All content is of a general nature and may not address the specific circumstances of any individual or entity. It is not a substitute for professional advice or services. Any actions you take based on the information provided here are strictly at your own risk. You accept full responsibility for any decisions or outcomes arising from your use of this website and agree to release us from any liability in connection with your use of, or reliance upon, the content or products found herein.