
|
Willdan Group, Inc. (WLDN) Évaluation DCF |
Entièrement Modifiable: Adapté À Vos Besoins Dans Excel Ou Sheets
Conception Professionnelle: Modèles Fiables Et Conformes Aux Normes Du Secteur
Pré-Construits Pour Une Utilisation Rapide Et Efficace
Compatible MAC/PC, entièrement débloqué
Aucune Expertise N'Est Requise; Facile À Suivre
Willdan Group, Inc. (WLDN) Bundle
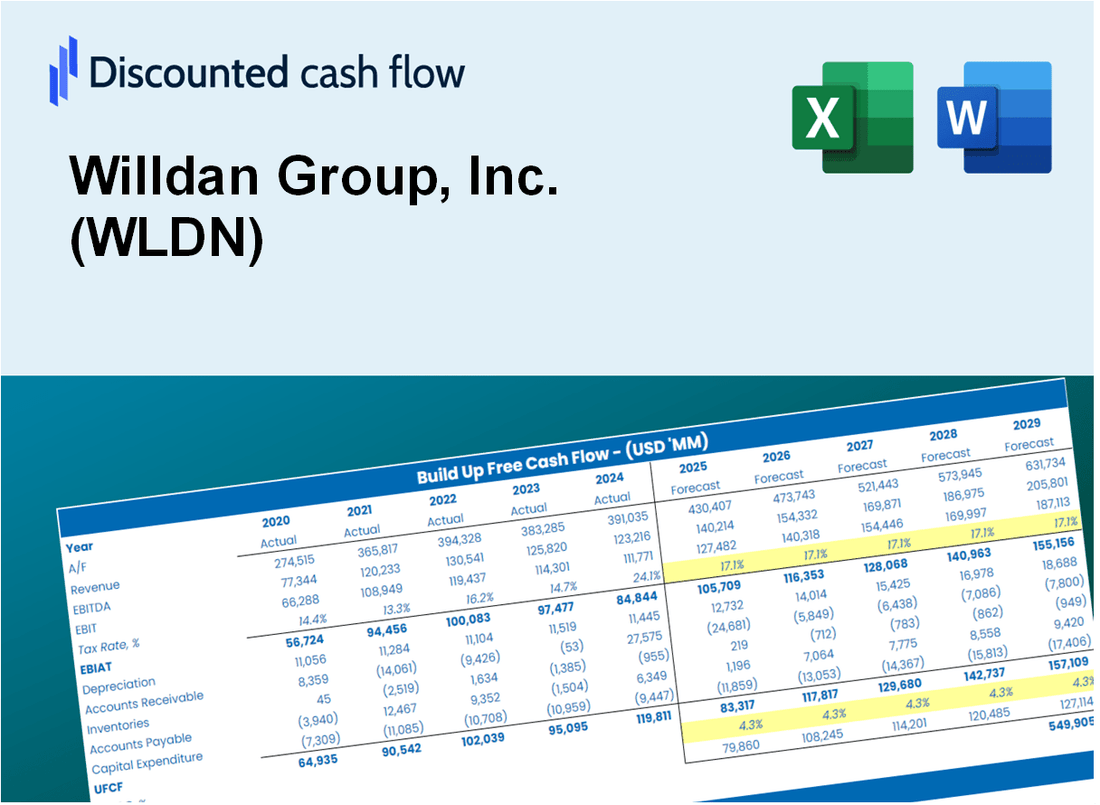
Gagnez du temps et améliorez la précision avec notre calculatrice DCF (WLDN)! Propulsé par des données réelles de Willdan Group, Inc. et des hypothèses personnalisables, cet outil vous permet de prévoir, analyser et valoriser (WLDN) comme un investisseur expert.
What You Will Receive
- Adjustable Forecast Parameters: Modify key inputs (growth %, margins, WACC) to explore various scenarios.
- Real-Time Financial Data: Willdan Group, Inc.'s (WLDN) financial information pre-loaded to facilitate your analysis.
- Instant DCF Calculations: The template automatically computes Net Present Value (NPV) and intrinsic value.
- Tailored and Professional Design: A refined Excel model that meets your valuation requirements.
- Designed for Analysts and Investors: Perfect for evaluating projections, confirming strategies, and enhancing efficiency.
Key Features
- 🔍 Real-Life WLDN Financials: Pre-filled historical and projected data for Willdan Group, Inc. (WLDN).
- ✏️ Fully Customizable Inputs: Adjust all critical parameters (yellow cells) like WACC, growth %, and tax rates.
- 📊 Professional DCF Valuation: Built-in formulas calculate Willdan’s intrinsic value using the Discounted Cash Flow method.
- ⚡ Instant Results: Visualize Willdan’s valuation instantly after making changes.
- Scenario Analysis: Test and compare outcomes for various financial assumptions side-by-side.
How It Works
- Step 1: Download the Excel file for Willdan Group, Inc. (WLDN).
- Step 2: Review Willdan's pre-filled financial data and projections.
- Step 3: Adjust key inputs such as revenue growth, WACC, and tax rates (highlighted cells).
- Step 4: Observe the DCF model refresh in real-time as you modify your assumptions.
- Step 5: Evaluate the outputs and leverage the results for your investment strategies.
Why Choose Willdan Group, Inc. (WLDN)?
- Save Time: Quickly access comprehensive solutions without starting from scratch.
- Enhance Accuracy: Leverage dependable data and methodologies to minimize errors in analysis.
- Fully Customizable: Adjust our services to align with your specific needs and forecasts.
- Simple to Understand: Intuitive reports and visuals facilitate straightforward interpretation of results.
- Trusted by Professionals: Developed for industry experts who prioritize accuracy and efficiency.
Who Should Use Willdan Group, Inc. (WLDN)?
- Investors: Gain insights into market trends and make informed investment choices with our comprehensive analysis tools.
- Financial Analysts: Streamline your workflow with our customizable financial modeling solutions tailored for efficiency.
- Consultants: Effortlessly modify our templates for impactful client presentations and detailed reports.
- Finance Enthusiasts: Enhance your knowledge of financial strategies with practical examples and case studies.
- Educators and Students: Utilize our resources as an effective teaching aid in finance and economics courses.
What the Willdan Group Template Contains
- Comprehensive DCF Model: Editable template featuring detailed valuation calculations.
- Real-World Data: Willdan Group’s historical and projected financials preloaded for analysis.
- Customizable Parameters: Adjust WACC, growth rates, and tax assumptions to explore various scenarios.
- Financial Statements: Complete annual and quarterly breakdowns for enhanced insights.
- Key Ratios: Integrated analysis for profitability, efficiency, and leverage metrics.
- Dashboard with Visual Outputs: Charts and tables for clear, actionable insights.
Disclaimer
All information, articles, and product details provided on this website are for general informational and educational purposes only. We do not claim any ownership over, nor do we intend to infringe upon, any trademarks, copyrights, logos, brand names, or other intellectual property mentioned or depicted on this site. Such intellectual property remains the property of its respective owners, and any references here are made solely for identification or informational purposes, without implying any affiliation, endorsement, or partnership.
We make no representations or warranties, express or implied, regarding the accuracy, completeness, or suitability of any content or products presented. Nothing on this website should be construed as legal, tax, investment, financial, medical, or other professional advice. In addition, no part of this site—including articles or product references—constitutes a solicitation, recommendation, endorsement, advertisement, or offer to buy or sell any securities, franchises, or other financial instruments, particularly in jurisdictions where such activity would be unlawful.
All content is of a general nature and may not address the specific circumstances of any individual or entity. It is not a substitute for professional advice or services. Any actions you take based on the information provided here are strictly at your own risk. You accept full responsibility for any decisions or outcomes arising from your use of this website and agree to release us from any liability in connection with your use of, or reliance upon, the content or products found herein.