
|
Worthington Industries, Inc. (WOR) Évaluation DCF |
Entièrement Modifiable: Adapté À Vos Besoins Dans Excel Ou Sheets
Conception Professionnelle: Modèles Fiables Et Conformes Aux Normes Du Secteur
Pré-Construits Pour Une Utilisation Rapide Et Efficace
Compatible MAC/PC, entièrement débloqué
Aucune Expertise N'Est Requise; Facile À Suivre
Worthington Industries, Inc. (WOR) Bundle
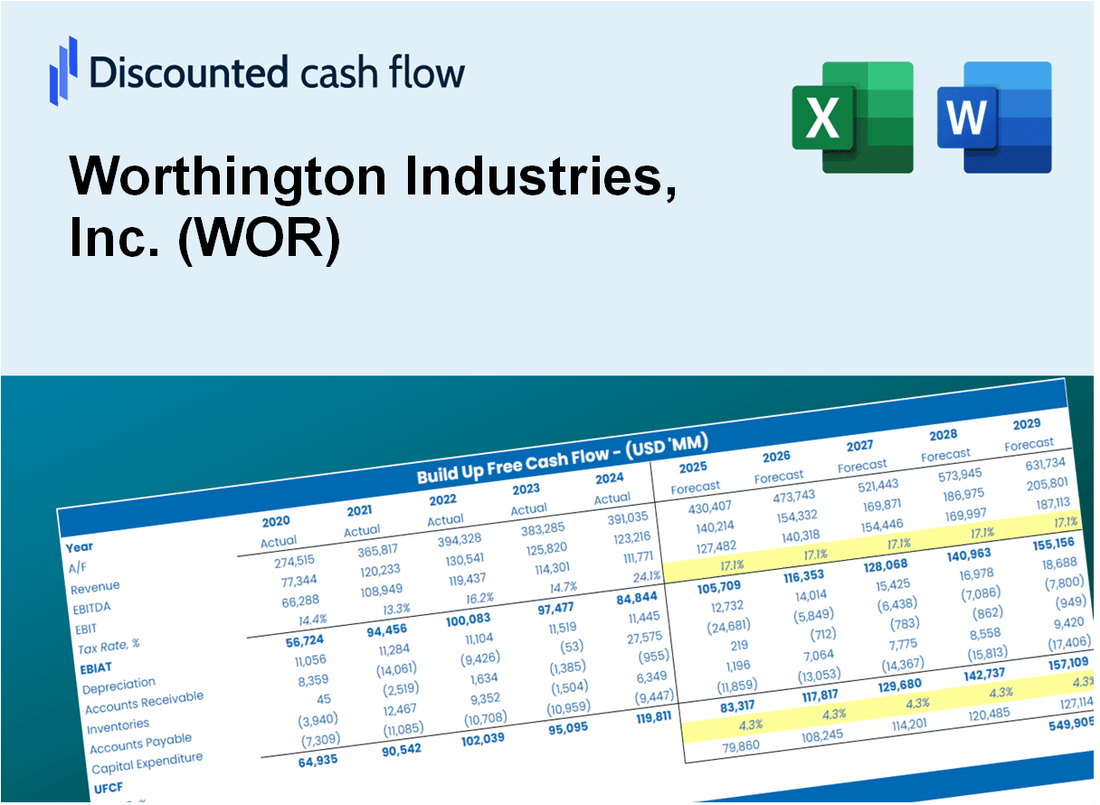
Gardez un aperçu de votre analyse d'évaluation de votre Worthington Industries, Inc. (WOR) avec notre calculatrice sophistiquée DCF! Ce modèle Excel est préchargé avec des données réelles (WOR), vous permettant d'ajuster les prévisions et les hypothèses pour déterminer avec précision la valeur intrinsèque de Worthington Industries, Inc.
What You Will Get
- Real WOR Financial Data: Pre-filled with Worthington Industries' historical and projected data for precise analysis.
- Fully Editable Template: Modify key inputs like revenue growth, WACC, and EBITDA % with ease.
- Automatic Calculations: See Worthington Industries' intrinsic value update instantly based on your changes.
- Professional Valuation Tool: Designed for investors, analysts, and consultants seeking accurate DCF results.
- User-Friendly Design: Simple structure and clear instructions for all experience levels.
Key Features
- Comprehensive DCF Calculator: Offers detailed unlevered and levered DCF valuation models tailored for Worthington Industries, Inc. (WOR).
- WACC Calculator: Features a pre-built Weighted Average Cost of Capital sheet with customizable inputs specific to (WOR).
- Adjustable Forecast Assumptions: Easily modify growth rates, capital expenditures, and discount rates to fit (WOR) projections.
- Integrated Financial Ratios: Evaluate profitability, leverage, and efficiency ratios pertinent to Worthington Industries, Inc. (WOR).
- Interactive Dashboard and Charts: Visual representations summarize essential valuation metrics for straightforward analysis of (WOR).
How It Works
- Step 1: Download the prebuilt Excel template with Worthington Industries, Inc. (WOR) data included.
- Step 2: Explore the pre-filled sheets and understand the key metrics.
- Step 3: Update forecasts and assumptions in the editable yellow cells (WACC, growth, margins).
- Step 4: Instantly view recalculated results, including Worthington Industries, Inc. (WOR) intrinsic value.
- Step 5: Make informed investment decisions or generate reports using the outputs.
Why Choose This Calculator for Worthington Industries, Inc. (WOR)?
- Comprehensive Tool: Features DCF, WACC, and financial ratio analyses tailored for Worthington Industries.
- Customizable Inputs: Modify the yellow-highlighted cells to explore different financial scenarios.
- Detailed Insights: Automatically computes Worthington's intrinsic value and Net Present Value.
- Preloaded Data: Access to historical and projected data for reliable analysis.
- Professional Quality: Perfect for financial analysts, investors, and business consultants focusing on Worthington Industries.
Who Should Use Worthington Industries, Inc. (WOR)?
- Investors: Gain insights into market trends and make informed investment choices.
- Financial Analysts: Utilize comprehensive data for in-depth analysis and reporting.
- Consultants: Leverage industry-specific insights for tailored client solutions.
- Finance Enthusiasts: Explore the intricacies of the steel and manufacturing sectors with real-time data.
- Educators and Students: Employ it as a resource for case studies and practical applications in finance education.
What the Template Contains
- Preloaded WOR Data: Historical and projected financial data, including revenue, EBIT, and capital expenditures.
- DCF and WACC Models: Professional-grade sheets for calculating intrinsic value and Weighted Average Cost of Capital.
- Editable Inputs: Yellow-highlighted cells for adjusting revenue growth, tax rates, and discount rates.
- Financial Statements: Comprehensive annual and quarterly financials for deeper analysis.
- Key Ratios: Profitability, leverage, and efficiency ratios to evaluate performance.
- Dashboard and Charts: Visual summaries of valuation outcomes and assumptions.
Disclaimer
All information, articles, and product details provided on this website are for general informational and educational purposes only. We do not claim any ownership over, nor do we intend to infringe upon, any trademarks, copyrights, logos, brand names, or other intellectual property mentioned or depicted on this site. Such intellectual property remains the property of its respective owners, and any references here are made solely for identification or informational purposes, without implying any affiliation, endorsement, or partnership.
We make no representations or warranties, express or implied, regarding the accuracy, completeness, or suitability of any content or products presented. Nothing on this website should be construed as legal, tax, investment, financial, medical, or other professional advice. In addition, no part of this site—including articles or product references—constitutes a solicitation, recommendation, endorsement, advertisement, or offer to buy or sell any securities, franchises, or other financial instruments, particularly in jurisdictions where such activity would be unlawful.
All content is of a general nature and may not address the specific circumstances of any individual or entity. It is not a substitute for professional advice or services. Any actions you take based on the information provided here are strictly at your own risk. You accept full responsibility for any decisions or outcomes arising from your use of this website and agree to release us from any liability in connection with your use of, or reliance upon, the content or products found herein.