
|
Whitbread plc (WTB.L) Valation DCF |
Entièrement Modifiable: Adapté À Vos Besoins Dans Excel Ou Sheets
Conception Professionnelle: Modèles Fiables Et Conformes Aux Normes Du Secteur
Pré-Construits Pour Une Utilisation Rapide Et Efficace
Compatible MAC/PC, entièrement débloqué
Aucune Expertise N'Est Requise; Facile À Suivre
Whitbread plc (WTB.L) Bundle
Évaluez les perspectives financières de Whitbread PLC comme un expert! Cette calculatrice DCF (WTBL) est livrée avec des finances pré-remplies et offre une pleine flexibilité pour modifier la croissance des revenus, le WACC, les marges et d'autres hypothèses critiques pour s'aligner sur vos projections.
Discounted Cash Flow (DCF) - (USD MM)
| Year | AY1 2021 |
AY2 2022 |
AY3 2023 |
AY4 2024 |
AY5 2025 |
FY1 2026 |
FY2 2027 |
FY3 2028 |
FY4 2029 |
FY5 2030 |
|---|---|---|---|---|---|---|---|---|---|---|
| Revenue | 588.9 | 1,703.4 | 2,625.2 | 2,959.9 | 2,921.9 | 4,131.4 | 5,841.6 | 8,259.8 | 11,679.0 | 16,513.5 |
| Revenue Growth, % | 0 | 189.25 | 54.12 | 12.75 | -1.28 | 41.4 | 41.4 | 41.4 | 41.4 | 41.4 |
| EBITDA | -547.8 | 554.4 | 883.7 | 1,013.3 | 957.0 | 332.0 | 469.4 | 663.7 | 938.4 | 1,326.9 |
| EBITDA, % | -93.02 | 32.55 | 33.66 | 34.23 | 32.75 | 8.03 | 8.03 | 8.03 | 8.03 | 8.03 |
| Depreciation | 300.2 | 326.9 | 345.5 | 383.4 | 401.8 | 909.2 | 1,285.5 | 1,817.7 | 2,570.1 | 3,634.1 |
| Depreciation, % | 50.98 | 19.19 | 13.16 | 12.95 | 13.75 | 22.01 | 22.01 | 22.01 | 22.01 | 22.01 |
| EBIT | -848.0 | 227.5 | 538.2 | 629.9 | 555.2 | -213.7 | -302.1 | -427.2 | -604.1 | -854.1 |
| EBIT, % | -144 | 13.36 | 20.5 | 21.28 | 19 | -5.17 | -5.17 | -5.17 | -5.17 | -5.17 |
| Total Cash | 1,256.0 | 1,132.4 | 1,164.8 | 696.7 | 909.0 | 2,193.8 | 3,101.9 | 4,385.9 | 6,201.5 | 8,768.6 |
| Total Cash, percent | .0 | .0 | .0 | .0 | .0 | .0 | .0 | .0 | .0 | .0 |
| Account Receivables | 56.6 | 116.4 | 141.8 | 119.3 | 127.1 | 249.8 | 353.1 | 499.3 | 706.0 | 998.3 |
| Account Receivables, % | 9.61 | 6.83 | 5.4 | 4.03 | 4.35 | 6.05 | 6.05 | 6.05 | 6.05 | 6.05 |
| Inventories | 12.1 | 19.4 | 21.7 | 21.2 | 17.1 | 44.0 | 62.2 | 87.9 | 124.3 | 175.8 |
| Inventories, % | 2.05 | 1.14 | 0.8266 | 0.71624 | 0.58524 | 1.06 | 1.06 | 1.06 | 1.06 | 1.06 |
| Accounts Payable | 316.5 | 570.7 | 676.7 | 91.9 | 660.8 | 1,146.4 | 1,621.0 | 2,292.0 | 3,240.8 | 4,582.3 |
| Accounts Payable, % | 53.74 | 33.5 | 25.78 | 3.1 | 22.62 | 27.75 | 27.75 | 27.75 | 27.75 | 27.75 |
| Capital Expenditure | -228.2 | -221.5 | -518.8 | -508.5 | -498.2 | -873.8 | -1,235.5 | -1,746.9 | -2,470.0 | -3,492.5 |
| Capital Expenditure, % | -38.75 | -13 | -19.76 | -17.18 | -17.05 | -21.15 | -21.15 | -21.15 | -21.15 | -21.15 |
| Tax Rate, % | 31.02 | 31.02 | 31.02 | 31.02 | 31.02 | 31.02 | 31.02 | 31.02 | 31.02 | 31.02 |
| EBITAT | -768.9 | 167.3 | 402.7 | 435.2 | 383.0 | -161.2 | -227.9 | -322.2 | -455.6 | -644.2 |
| Depreciation | ||||||||||
| Changes in Account Receivables | ||||||||||
| Changes in Inventories | ||||||||||
| Changes in Accounts Payable | ||||||||||
| Capital Expenditure | ||||||||||
| UFCF | -449.1 | 459.8 | 307.7 | -251.7 | 851.8 | 210.4 | 175.2 | 247.7 | 350.2 | 495.2 |
| WACC, % | 5.03 | 4.69 | 4.71 | 4.6 | 4.6 | 4.72 | 4.72 | 4.72 | 4.72 | 4.72 |
| PV UFCF | ||||||||||
| SUM PV UFCF | 1,260.6 | |||||||||
| Long Term Growth Rate, % | 3.00 | |||||||||
| Free cash flow (T + 1) | 510 | |||||||||
| Terminal Value | 29,582 | |||||||||
| Present Terminal Value | 23,485 | |||||||||
| Enterprise Value | 24,746 | |||||||||
| Net Debt | 4,717 | |||||||||
| Equity Value | 20,028 | |||||||||
| Diluted Shares Outstanding, MM | 181 | |||||||||
| Equity Value Per Share | 11,096.02 |
What You Will Receive
- Customizable Excel Template: An adaptable Excel-based DCF Calculator featuring pre-populated financial data for Whitbread plc (WTBL).
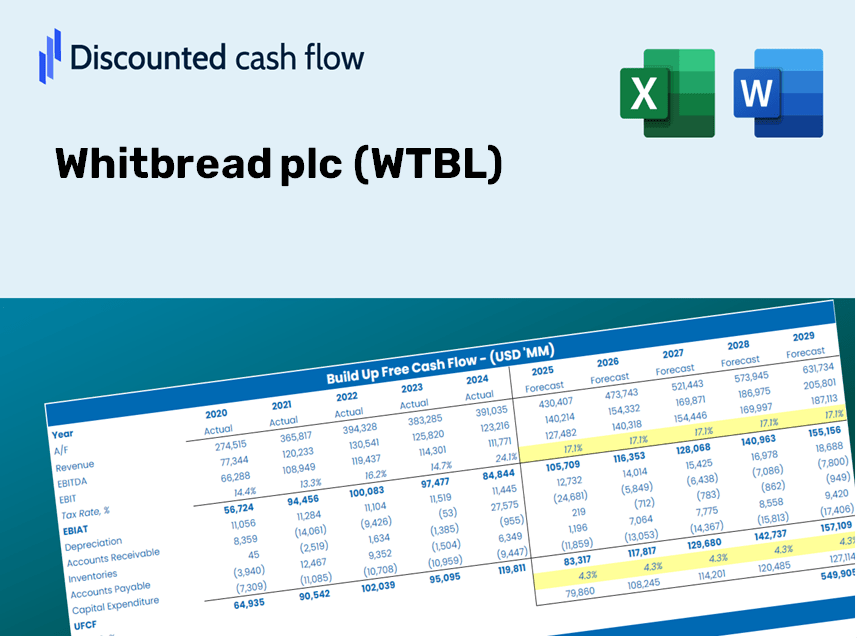
- Real-Time Data: Access to historical performance data and forward-looking projections (highlighted in the yellow cells).
- Flexible Forecasting: Modify key assumptions such as revenue growth, EBITDA percentage, and WACC.
- Instant Calculations: Quickly observe how your inputs affect Whitbread plc's (WTBL) valuation.
- Professional Resource: Designed for investors, CFOs, consultants, and financial analysts.
- User-Friendly Interface: Organized for straightforward navigation, complete with step-by-step guidance.
Key Features
- 🔍 Real-Life WTBL Financials: Access historical and projected data pre-filled for Whitbread plc.
- ✏️ Fully Customizable Inputs: Modify essential parameters (yellow cells) such as WACC, growth %, and tax rates.
- 📊 Professional DCF Valuation: Leverage built-in formulas to calculate Whitbread’s intrinsic value using the Discounted Cash Flow approach.
- ⚡ Instant Results: Visualize the valuation of Whitbread instantly after any adjustments.
- Scenario Analysis: Evaluate and compare various financial assumptions side-by-side.
How It Works
- Step 1: Download the Excel file.
- Step 2: Review Whitbread plc’s pre-filled financial data and forecasts.
- Step 3: Adjust key inputs such as revenue growth, WACC, and tax rates (highlighted cells).
- Step 4: Observe the DCF model update in real-time as you modify your assumptions.
- Step 5: Evaluate the results and utilize the findings for your investment decisions.
Why Choose Whitbread plc (WTBL) Calculator?
- Save Time: Instantly access a fully prepared DCF model with no need for tedious setup.
- Enhance Accuracy: Dependable financial data and formulas minimize valuation errors.
- Completely Customizable: Adjust the model to align with your specific assumptions and forecasts.
- User-Friendly: Intuitive charts and outputs simplify the analysis of results.
- Preferred by Professionals: Crafted for experts who prioritize both accuracy and ease of use.
Who Can Benefit from This Product?
- Finance Students: Master valuation techniques and apply them with real-world data.
- Academics: Integrate professional valuation models into your teaching or research projects.
- Investors: Validate your investment hypotheses and evaluate valuation results for Whitbread plc (WTBL).
- Analysts: Enhance your efficiency with a customizable DCF model designed for your needs.
- Small Business Owners: Learn how major public companies like Whitbread plc (WTBL) are assessed in the market.
Contents of the Template
- Detailed DCF Model: Editable framework with comprehensive valuation metrics.
- Real-Life Data: Whitbread plc’s (WTBL) historical and forecasted financial data preloaded for review.
- Adjustable Assumptions: Modify WACC, growth rates, and tax inputs to explore different scenarios.
- Complete Financial Statements: Thorough annual and quarterly analyses for enhanced understanding.
- Essential Ratios: Integrated assessment of profitability, efficiency, and financial leverage.
- Interactive Dashboard with Visuals: Graphs and tables to deliver clear and actionable insights.
Disclaimer
All information, articles, and product details provided on this website are for general informational and educational purposes only. We do not claim any ownership over, nor do we intend to infringe upon, any trademarks, copyrights, logos, brand names, or other intellectual property mentioned or depicted on this site. Such intellectual property remains the property of its respective owners, and any references here are made solely for identification or informational purposes, without implying any affiliation, endorsement, or partnership.
We make no representations or warranties, express or implied, regarding the accuracy, completeness, or suitability of any content or products presented. Nothing on this website should be construed as legal, tax, investment, financial, medical, or other professional advice. In addition, no part of this site—including articles or product references—constitutes a solicitation, recommendation, endorsement, advertisement, or offer to buy or sell any securities, franchises, or other financial instruments, particularly in jurisdictions where such activity would be unlawful.
All content is of a general nature and may not address the specific circumstances of any individual or entity. It is not a substitute for professional advice or services. Any actions you take based on the information provided here are strictly at your own risk. You accept full responsibility for any decisions or outcomes arising from your use of this website and agree to release us from any liability in connection with your use of, or reliance upon, the content or products found herein.