
|
XOS, Inc. (XOS) Évaluation DCF |
Entièrement Modifiable: Adapté À Vos Besoins Dans Excel Ou Sheets
Conception Professionnelle: Modèles Fiables Et Conformes Aux Normes Du Secteur
Pré-Construits Pour Une Utilisation Rapide Et Efficace
Compatible MAC/PC, entièrement débloqué
Aucune Expertise N'Est Requise; Facile À Suivre
Xos, Inc. (XOS) Bundle
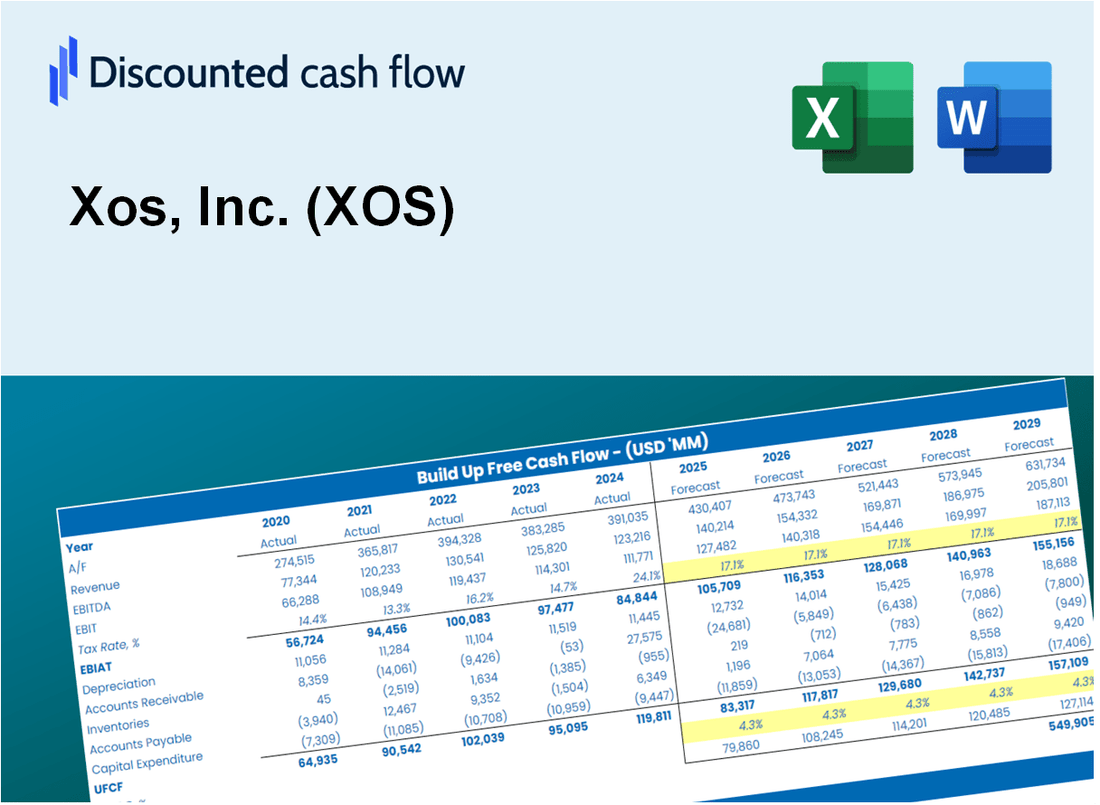
Conçu pour la précision, notre calculatrice (XOS) DCF vous permet d'évaluer l'évaluation XOS, Inc. à l'aide de données financières réelles, offrant une flexibilité complète pour modifier tous les paramètres essentiels pour des projections améliorées.
What You Will Receive
- Comprehensive Financial Model: Xos, Inc.’s actual data facilitates accurate DCF valuation.
- Complete Forecast Flexibility: Modify revenue growth, margins, WACC, and other essential metrics.
- Real-Time Calculations: Automatic updates provide immediate insights as you adjust parameters.
- Professional-Grade Template: An enhanced Excel file tailored for high-quality valuation presentations.
- Adaptable and Reusable: Designed for versatility, allowing for repeated use in intricate forecasts.
Key Features
- 🔍 Real-Life XOS Financials: Pre-filled historical and projected data for Xos, Inc. (XOS).
- ✏️ Fully Customizable Inputs: Adjust all critical parameters (yellow cells) like WACC, growth %, and tax rates.
- 📊 Professional DCF Valuation: Built-in formulas calculate Xos’s intrinsic value using the Discounted Cash Flow method.
- ⚡ Instant Results: Visualize Xos’s valuation instantly after making changes.
- Scenario Analysis: Test and compare outcomes for various financial assumptions side-by-side.
How It Works
- 1. Access the Template: Download and open the Excel file containing Xos, Inc.'s preloaded data.
- 2. Adjust Key Inputs: Modify essential parameters such as growth rates, WACC, and capital expenditures.
- 3. Analyze Results in Real-Time: The DCF model automatically computes intrinsic value and NPV.
- 4. Explore Different Scenarios: Evaluate various forecasts to investigate alternative valuation results.
- 5. Present with Assurance: Deliver professional valuation insights to enhance your decision-making process.
Why Choose Xos, Inc. (XOS)?
- Innovative Solutions: Leverage cutting-edge technology designed to enhance efficiency.
- Proven Performance: Our products are backed by data and have a track record of success in the industry.
- Customizable Options: Adapt our offerings to meet your specific business needs and goals.
- User-Friendly Interface: Intuitive design ensures a seamless experience for all users.
- Expert Support: Our dedicated team is always available to assist with any inquiries or challenges.
Who Should Use This Product?
- Professional Investors: Develop comprehensive and trustworthy valuation models for analyzing Xos, Inc. (XOS) investments.
- Corporate Finance Teams: Evaluate valuation scenarios to inform strategic decisions within the organization.
- Consultants and Advisors: Deliver precise valuation insights for clients interested in Xos, Inc. (XOS).
- Students and Educators: Utilize real-world data to enhance learning and practice in financial modeling.
- Tech Enthusiasts: Gain insights into how innovative companies like Xos, Inc. (XOS) are assessed in the financial market.
What the Template Contains
- Preloaded XOS Data: Historical and projected financial data, including revenue, EBIT, and capital expenditures.
- DCF and WACC Models: Professional-grade sheets for calculating intrinsic value and Weighted Average Cost of Capital.
- Editable Inputs: Yellow-highlighted cells for adjusting revenue growth, tax rates, and discount rates.
- Financial Statements: Comprehensive annual and quarterly financials for deeper analysis.
- Key Ratios: Profitability, leverage, and efficiency ratios to evaluate performance.
- Dashboard and Charts: Visual summaries of valuation outcomes and assumptions.
Disclaimer
All information, articles, and product details provided on this website are for general informational and educational purposes only. We do not claim any ownership over, nor do we intend to infringe upon, any trademarks, copyrights, logos, brand names, or other intellectual property mentioned or depicted on this site. Such intellectual property remains the property of its respective owners, and any references here are made solely for identification or informational purposes, without implying any affiliation, endorsement, or partnership.
We make no representations or warranties, express or implied, regarding the accuracy, completeness, or suitability of any content or products presented. Nothing on this website should be construed as legal, tax, investment, financial, medical, or other professional advice. In addition, no part of this site—including articles or product references—constitutes a solicitation, recommendation, endorsement, advertisement, or offer to buy or sell any securities, franchises, or other financial instruments, particularly in jurisdictions where such activity would be unlawful.
All content is of a general nature and may not address the specific circumstances of any individual or entity. It is not a substitute for professional advice or services. Any actions you take based on the information provided here are strictly at your own risk. You accept full responsibility for any decisions or outcomes arising from your use of this website and agree to release us from any liability in connection with your use of, or reliance upon, the content or products found herein.