
|
XPEL, Inc. (XPEL) Évaluation DCF |
Entièrement Modifiable: Adapté À Vos Besoins Dans Excel Ou Sheets
Conception Professionnelle: Modèles Fiables Et Conformes Aux Normes Du Secteur
Pré-Construits Pour Une Utilisation Rapide Et Efficace
Compatible MAC/PC, entièrement débloqué
Aucune Expertise N'Est Requise; Facile À Suivre
XPEL, Inc. (XPEL) Bundle
Améliorez votre stratégie d'investissement avec la calculatrice DCF XPEL, Inc. (XPEL)! Explorez les données financières XPEL authentiques, ajustez les projections et dépenses de croissance et observez instantanément comment ces modifications affectent la valeur intrinsèque de XPEL, Inc. (XPEL).
What You Will Get
- Pre-Filled Financial Model: XPEL's actual data provides accurate DCF valuation.
- Full Forecast Control: Modify revenue growth, margins, WACC, and other essential drivers.
- Instant Calculations: Automatic updates allow you to view results in real-time as you make adjustments.
- Investor-Ready Template: A polished Excel file crafted for professional-level valuation.
- Customizable and Reusable: Designed for adaptability, enabling repeated use for comprehensive forecasts.
Key Features
- Comprehensive XPEL Data: Pre-filled with XPEL’s historical performance metrics and future growth estimates.
- Customizable Assumptions: Modify revenue growth rates, profit margins, discount rates, tax implications, and capital investments.
- Interactive Valuation Framework: Real-time adjustments to Net Present Value (NPV) and intrinsic value based on your parameters.
- Scenario Analysis: Develop various forecasting scenarios to evaluate different valuation possibilities.
- Intuitive Interface: Clean, organized, and designed for both experts and novices.
How It Works
- Download the Template: Gain immediate access to the Excel-based XPEL DCF Calculator.
- Input Your Assumptions: Modify the yellow-highlighted cells for growth rates, WACC, margins, and other variables.
- Instant Calculations: The model will automatically refresh XPEL’s intrinsic value.
- Test Scenarios: Experiment with various assumptions to assess potential valuation shifts.
- Analyze and Decide: Utilize the findings to inform your investment or financial strategy.
Why Choose This Calculator for XPEL, Inc. (XPEL)?
- User-Friendly Interface: Perfect for both novices and seasoned professionals.
- Customizable Inputs: Easily adjust parameters to suit your specific analysis needs.
- Real-Time Updates: Watch XPEL’s valuation change instantly as you modify inputs.
- Preloaded Data: Comes with XPEL’s actual financial figures for swift evaluations.
- Relied Upon by Experts: Favored by investors and analysts for making well-informed choices.
Who Should Use This Product?
- Investors: Evaluate XPEL’s valuation prior to making investment decisions.
- CFOs and Financial Analysts: Optimize valuation methodologies and assess financial forecasts.
- Startup Founders: Understand the valuation strategies of established companies like XPEL.
- Consultants: Provide detailed valuation analyses for clients in the automotive industry.
- Students and Educators: Utilize real-time data to learn and teach valuation principles.
What the Template Contains
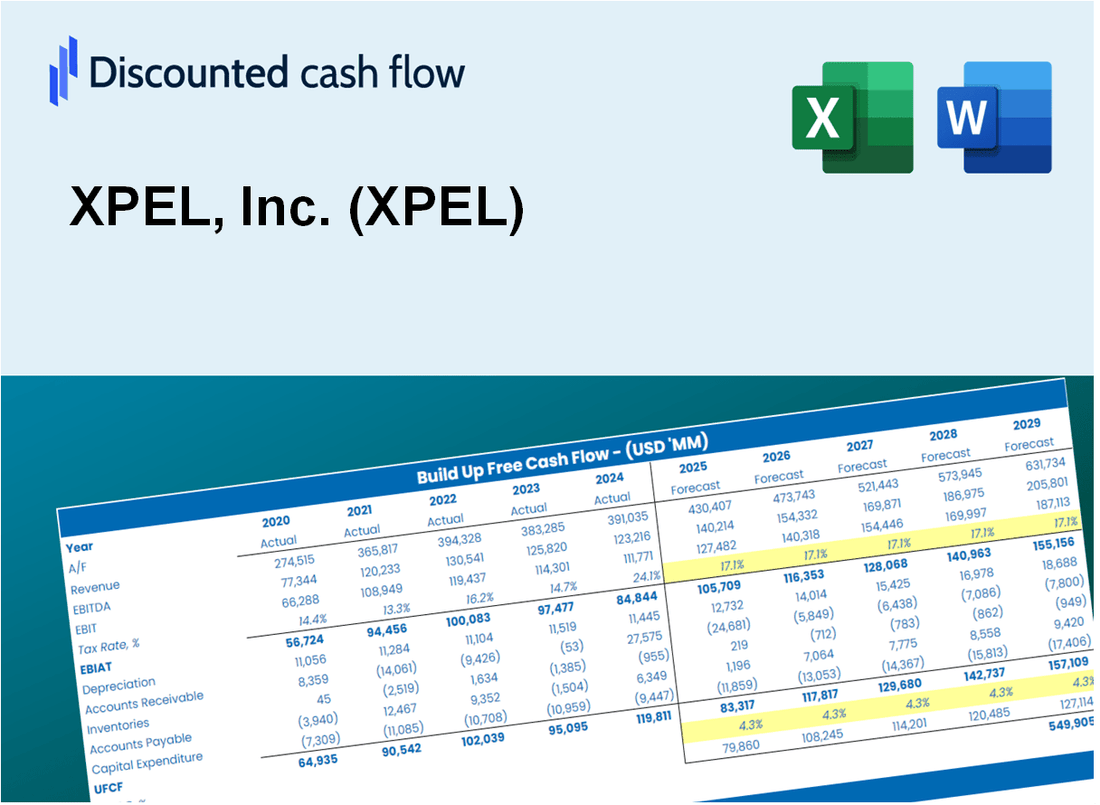
- Operating and Balance Sheet Data: Pre-filled XPEL historical data and forecasts, including revenue, EBITDA, EBIT, and capital expenditures.
- WACC Calculation: A dedicated sheet for Weighted Average Cost of Capital (WACC), including parameters like Beta, risk-free rate, and share price.
- DCF Valuation (Unlevered and Levered): Editable Discounted Cash Flow models showing intrinsic value with detailed calculations.
- Financial Statements: Pre-loaded financial statements (annual and quarterly) to support analysis.
- Key Ratios: Includes profitability, leverage, and efficiency ratios for XPEL.
- Dashboard and Charts: Visual summary of valuation outputs and assumptions to analyze results easily.
Disclaimer
All information, articles, and product details provided on this website are for general informational and educational purposes only. We do not claim any ownership over, nor do we intend to infringe upon, any trademarks, copyrights, logos, brand names, or other intellectual property mentioned or depicted on this site. Such intellectual property remains the property of its respective owners, and any references here are made solely for identification or informational purposes, without implying any affiliation, endorsement, or partnership.
We make no representations or warranties, express or implied, regarding the accuracy, completeness, or suitability of any content or products presented. Nothing on this website should be construed as legal, tax, investment, financial, medical, or other professional advice. In addition, no part of this site—including articles or product references—constitutes a solicitation, recommendation, endorsement, advertisement, or offer to buy or sell any securities, franchises, or other financial instruments, particularly in jurisdictions where such activity would be unlawful.
All content is of a general nature and may not address the specific circumstances of any individual or entity. It is not a substitute for professional advice or services. Any actions you take based on the information provided here are strictly at your own risk. You accept full responsibility for any decisions or outcomes arising from your use of this website and agree to release us from any liability in connection with your use of, or reliance upon, the content or products found herein.