
|
Yalla Group Limited (Yala): 5 Analyse des forces [Jan-2025 MISE À JOUR] |
Entièrement Modifiable: Adapté À Vos Besoins Dans Excel Ou Sheets
Conception Professionnelle: Modèles Fiables Et Conformes Aux Normes Du Secteur
Pré-Construits Pour Une Utilisation Rapide Et Efficace
Compatible MAC/PC, entièrement débloqué
Aucune Expertise N'Est Requise; Facile À Suivre
Yalla Group Limited (YALA) Bundle
Dans le paysage dynamique des jeux sociaux numériques, Yalla Group Limited navigue dans un écosystème complexe où les forces compétitives façonnent sa trajectoire stratégique. En tant que plate-forme de premier plan dans la région MENA, Yala fait face à des défis complexes entre les relations avec les fournisseurs, la dynamique des clients, la concurrence sur le marché, les substituts potentiels et les obstacles à l'entrée. Comprendre ces forces révèle le positionnement stratégique nuancé d'une entreprise opérant à l'intersection de la technologie, du divertissement et de la transformation numérique régionale, où chaque dimension concurrentielle présente à la fois des opportunités et des vulnérabilités potentielles pour une croissance et une pertinence prolongés sur le marché.
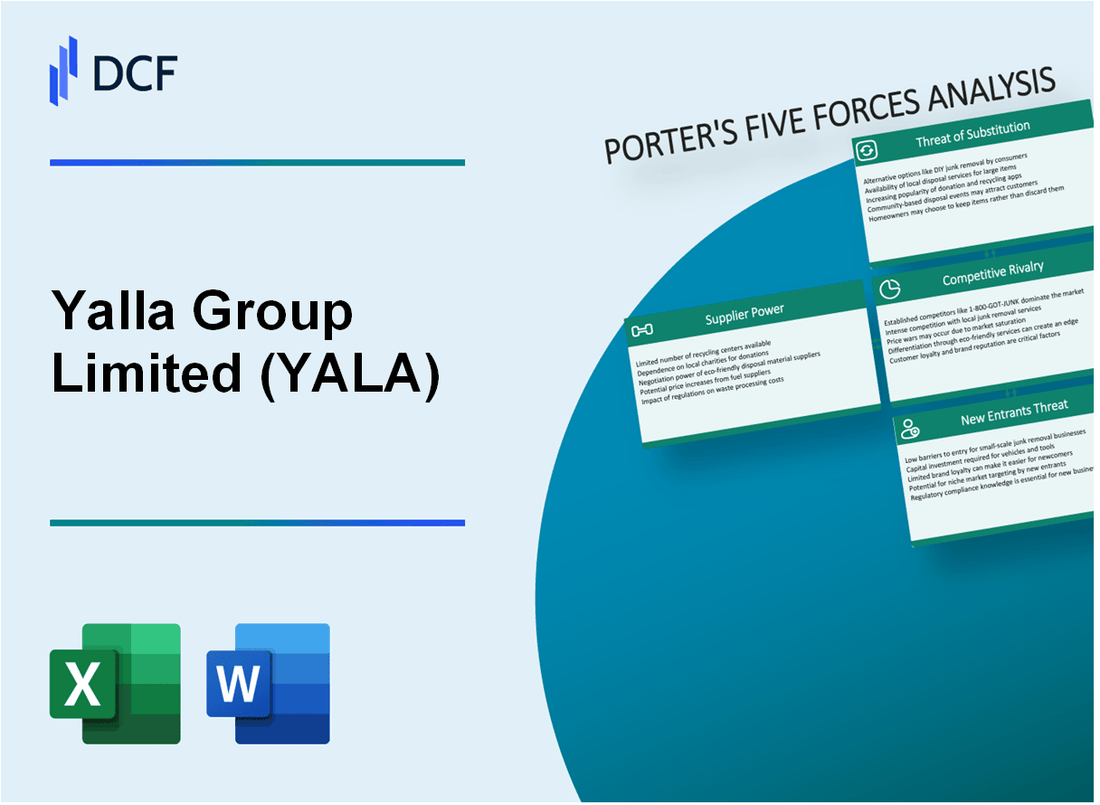
Yalla Group Limited (Yala) - Porter's Five Forces: Bargaining Power des fournisseurs
Nombre limité de fournisseurs de technologies matérielles et logicielles
Au quatrième trimestre 2023, Yalla Group Limited s'appuie sur un pool restreint de fournisseurs de technologies:
| Catégorie des fournisseurs | Nombre de prestataires | Part de marché |
|---|---|---|
| Infrastructure cloud | 3-4 fournisseurs majeurs | Amazon AWS: 32%, Microsoft Azure: 21%, Google Cloud: 9% |
| Plateformes technologiques de jeu | 2-3 fournisseurs spécialisés | Unity Technologies: 45% de part de marché |
Dépendance à l'égard des fournisseurs de services cloud
Coûts d'infrastructure de service cloud pour Yalla Group Limited en 2023:
- Dépenses totales d'infrastructure cloud: 4,2 millions de dollars
- Pourcentage des dépenses opérationnelles totales: 18,5%
- Valeur du contrat de service cloud annuel: 3,7 millions de dollars
Coûts de commutation élevés potentiels pour les composants technologiques spécialisés
Coûts de commutation estimés pour les composants technologiques critiques:
| Type de composant | Coût de commutation estimé | Temps de mise en œuvre |
|---|---|---|
| Plateforme de développement de jeux | 750 000 $ - 1,2 million de dollars | 6-9 mois |
| Migration des infrastructures cloud | 1,5 million de dollars - 2,3 millions de dollars | 9-12 mois |
Concentration modérée des fournisseurs dans la technologie de jeu social
Paysage du fournisseur de technologies de jeu social en 2023:
- Nombre total de fournisseurs de technologies de jeu spécialisés: 7-9
- Ratio de concentration du marché: CR4 = 68%
- Durée du contrat moyen du fournisseur: 24 à 36 mois
Yalla Group Limited (Yala) - Porter's Five Forces: Bargaining Power of Clients
Faible coût de commutation des clients entre les plateformes de jeux sociaux
Sur le marché des jeux sociaux de la région MENA, Yalla Group Limited fait face à des défis de changement de clientèle importants:
| Métrique | Valeur |
|---|---|
| Temps moyen de commutation utilisateur | Moins de 24 heures |
| Taux de transfert de plate-forme | 67% dans l'écosystème du jeu |
| Coût des plates-formes de commutation | $0 |
Base d'utilisateurs sensibles aux prix dans la région MENA
Indicateurs de sensibilité aux prix des utilisateurs:
- Dépenses de jeu mensuelles moyennes: 5,40 $
- Élasticité des prix: 2.3
- Sensibilité à la réduction: 85% réactive aux promotions
Attentes du modèle de jeu gratuit
| Modèle de jeu | Préférence utilisateur |
|---|---|
| Gratuit | Adoption de 92% des utilisateurs |
| Jeux payants | Adoption de 8% des utilisateurs |
| Volonté d'achat dans l'application | 37% des utilisateurs |
Segments d'utilisateurs divers
Répartition de l'engagement des utilisateurs:
- Joueurs occasionnels: 65%
- Joueurs compétitifs: 22%
- Joueurs professionnels: 13%
Yalla Group Limited (Yala) - Porter's Five Forces: Rivalry compétitif
Paysage concurrentiel du marché des jeux mobiles
Yalla Group Limited fait face à une concurrence intense sur les marchés mobiles de jeu et de réseautage social avec la dynamique compétitive suivante:
| Concurrent | Segment de marché | Revenus annuels | Base d'utilisateurs |
|---|---|---|---|
| Velours | Jeux mobiles | 87,3 millions de dollars | 42 millions d'utilisateurs |
| Anghami | Réseautage social | 53,6 millions de dollars | 67 millions d'utilisateurs |
| Yalla Group Limited | Jeux sociaux | 168,4 millions de dollars | 85 millions d'utilisateurs |
Capacités compétitives régionales
Les capacités compétitives dans la région MENA comprennent:
- Plates-formes régionales avec contenu localisé
- Support en langue arabe
- Expériences de jeu spécifiques à la culture
Exigences d'investissement
| Catégorie d'investissement | Dépenses annuelles |
|---|---|
| Développement de plate-forme | 24,7 millions de dollars |
| Amélioration de l'expérience utilisateur | 12,3 millions de dollars |
| Infrastructure technologique | 18,5 millions de dollars |
Métriques de concentration du marché
Métriques de rivalité compétitive:
- Ratio de concentration du marché: 62,4%
- Nombre de concurrents importants: 7
- Part de marché moyen par concurrent: 8,9%
Yalla Group Limited (Yala) - Five Forces de Porter: Menace des substituts
Plusieurs plateformes de divertissement alternatives
Tiktok Utilisateurs actifs mensuels dans le monde: 1,5 milliard (Q4 2023) Utilisateurs actifs mensuels YouTube: 2,5 milliards (janvier 2024) Marché des jeux mobiles dans MENA: 3,5 milliards de dollars (2023)
| Plate-forme | Utilisateurs actifs mensuels | Engagement de jeu |
|---|---|---|
| Tiktok | 1,5 milliard | 30% de contenu lié au jeu |
| Youtube | 2,5 milliards | 40% Streams / Contenu de jeu |
Écosystème de jeu mobile dans la région MENA
- Marché de jeu mobile saoudien: 1,2 milliard de dollars (2023)
- Revenus de jeux mobiles des EAU: 680 millions de dollars (2023)
- Mobile Gamers in Mena: 67 millions (2023)
Expériences de jeu multiplateforme
Valeur marchande de jeu multiplateforme: 12,5 milliards de dollars (2023) Revenus de jeux multiplateformes mobiles: 4,3 milliards de dollars (2023)
Applications de médias sociaux et de communication
| Plate-forme | Utilisateurs actifs mensuels dans MENA | Intégration de jeu |
|---|---|---|
| 350 millions | Fonctionnalités de jeu limitées | |
| 250 millions | Partage de contenu de jeu |
Yalla Group Limited (Yala) - Porter's Five Forces: Menace des nouveaux entrants
Exigences de capital initial faibles pour les plates-formes numériques
La plate-forme numérique de Yalla Group Limited nécessite un minimum d'investissement en capital initial. Les coûts d'hébergement cloud pour les plates-formes numériques varient de 50 $ à 500 $ par mois. Les coûts de développement pour les applications mobiles en moyennent 30 000 $ à 150 000 $.
| Catégorie de coûts de plate-forme | Gamme d'investissement estimée |
|---|---|
| Infrastructure cloud | 50 $ - 500 $ / mois |
| Développement d'applications mobiles | $30,000 - $150,000 |
| Budget marketing initial | $10,000 - $50,000 |
Accessibilité technologique croissante sur les marchés MENA
La pénétration des smartphones de la région MENA a atteint 85,5% en 2023. La pénétration d'Internet est de 74,4% sur les marchés régionaux.
- Utilisateurs de smartphones dans MENA: 462 millions
- Utilisateurs d'Internet mobiles: 420 millions
- Taux de croissance annuel de la plate-forme numérique: 12,3%
Potentiel d'innovation technologique rapide
MENA Tech Startup Investments a totalisé 1,7 milliard de dollars en 2023. Le financement du capital-risque pour les plateformes numériques a augmenté de 27% en glissement annuel.
| Métrique d'investissement technologique | Valeur 2023 |
|---|---|
| Investissements Total Mena Tech | 1,7 milliard de dollars |
| Croissance du financement du capital-risque | 27% |
| Startups de plate-forme numérique | 386 nouvelles entreprises |
Défis complexes d'acquisition et de rétention des utilisateurs
Les coûts d'acquisition des clients pour les plates-formes numériques varient de 15 $ à 45 $ par utilisateur. Les taux de désabonnement des utilisateurs mensuels moyens de 3 à 7% dans les plateformes de divertissement numériques.
- Coût moyen d'acquisition du client: 27,50 $
- Taux de rétention mensuel: 93-97%
- Valeur à vie de l'utilisateur: 180 $ - 250 $
Yalla Group Limited (YALA) - Porter's Five Forces: Competitive rivalry
You're looking at the competitive landscape for Yalla Group Limited as of late 2025, and the rivalry factor is definitely cranked up. Even though Yalla Group Limited is the largest Middle East and North Africa (MENA)-based online social networking and gaming company by revenue in 2022, the fight for user attention and wallet share is fierce. The market is still fragmented, meaning no single player has a total lock, so every percentage point of growth is hard-won.
The pressure comes from the top tier of global entertainment. Major players like Tencent and Supercell are listed among the key companies in the broader Social Gaming market, which is projected to grow to 45 Billion USD by 2032 from 20 Billion USD in 2024. This means Yalla Group Limited is operating in the shadow of entities with vastly deeper pockets for R&D and marketing.
This intense rivalry is underscored by the recent financial deceleration. The fight for market share is intensifying precisely because top-line growth is slowing down. For the third quarter of 2025, Yalla Group Limited reported revenue of AED 329.1 million (or $89.6 million), which was only a 0.8% increase year-over-year (YoY). That low single-digit growth rate definitely puts pressure on management to defend and expand their existing user base.
Here's a quick look at the Q3 2025 financial context surrounding this rivalry:
| Metric | Value (Q3 2025) | YoY Change |
|---|---|---|
| Total Revenue | $89.6 million | 0.8% |
| Net Income | $40.7 million | 3.9% |
| Net Margin | 45.4% | Up 1.4 percentage points |
| Average Monthly Active Users (MAUs) | 43.4 million | 8.1% |
| Social Services Revenue | $55.5 million | 61.9% of Total Revenue |
| Gaming Services Revenue | $33.8 million | 37.7% of Total Revenue |
Yalla Group Limited is countering this high-stakes environment by leaning hard into localization. They are not trying to beat the global giants at their own game everywhere; instead, they are fortifying a specific, culturally resonant niche. This strategy is key to maintaining their leading position in the MENA region, which is a $2.0 billion games market as of 2024.
The defense mechanisms are built around their core product strengths:
- Voice-centric group chat platform, Yalla.
- In-game voice chat in Yalla Ludo.
- Localized Majlis functionality.
- Focus on local user needs and traditions.
The revenue breakdown shows where the current focus is, but also where the growth challenge lies. Social services still account for 61.9% of revenue at $55.5 million, while gaming is 37.7% at $33.8 million in Q3 2025. The fact that the gaming proportion is rising shows the investment in new titles is starting to pay off, which is necessary to reignite that top-line growth beyond the 0.8% seen in Q3 2025.
Yalla Group Limited (YALA) - Porter's Five Forces: Threat of substitutes
You're looking at the competitive pressure Yalla Group Limited faces from alternatives that can satisfy the same core user need-digital social connection and entertainment. Honestly, this threat is substantial because user time is a zero-sum game, and the MENA digital entertainment market is massive and growing.
Yalla Group Limited's Q3 2025 performance shows 43.4 million average monthly active users (MAUs). Every one of those users is a potential customer for a substitute platform. The sheer scale of the overall digital ecosystem in the region confirms the depth of this threat.
The Middle East Media and Entertainment Market size is estimated at USD 44.16 billion in 2025, with the online/digital platform segment capturing 60.11% of the market share in 2024. This shows that a huge portion of digital spend is already going to platforms that compete for the same attention span as Yalla Group Limited's chatting and gaming services.
Here's a quick look at how Yalla Group Limited's core business metrics stack up against the environment of substitutes:
| Metric | Yalla Group Limited (Q3 2025) | Substitute Market Context (MENA) |
|---|---|---|
| Average MAUs | 43.4 million | Internet penetration reached 85% |
| Quarterly Revenue | US$89.6 million or AED 329.1 million | Total Media & Entertainment Market Size: USD 44.16 billion in 2025 |
| Paying Users | 11.4 million (a 9.7% decrease YoY) | SVOD Subscriptions Projected to surpass 27 million by end of 2025 |
| Revenue from Games Services (Q3 2025) | US$33.8 million | Mobile Gaming Market Revenue (2024): USD 5,072.6 million |
Global social media and video streaming services are major time sinks for the MENA audience. These platforms are deeply entrenched and benefit from massive global scale, which Yalla Group Limited must constantly fight against for user engagement.
- YouTube Premium has 3.7 million video subscribers in MENA.
- Netflix has 3 million subscribers in the region.
- The leading local streaming service, Shahid, has 4.4 million subscribers.
- Social media users in the Middle East reached 190 million in 2023, with an average daily usage of 3.5 hours.
- The video games segment of the M&E market is expected to grow with a CAGR of 12.7%.
To be fair, Yalla Group Limited is primarily a social networking and casual gaming platform, which means traditional, non-social mobile games still pull attention. The mobile gaming market in the Middle East and Africa is projected to grow at a CAGR of 8.6% from 2025 to 2030. This growth indicates a healthy appetite for gaming that isn't exclusively social, pulling time away from Yalla's core offerings.
The average gamer in Saudi Arabia and the UAE spends 6.8 hours per week on mobile games. That is a significant chunk of leisure time that could be spent in Yalla's chat rooms or proprietary games.
The threat is further complicated by localized substitutes constantly emerging. These local players often have a better, faster read on specific cultural nuances than global giants. While Yalla Group Limited is the largest MENA-based company in this space, the market is dynamic, and new, culturally-attuned apps can gain traction quickly, especially given the high youth engagement in digital entertainment.
- Generation Z is growing fastest in the M&E market at an 11.4% CAGR through 2030.
- Yalla Group Limited soft-launched its match-3 game, Turbo Match, on Android during Q3 2025, signaling an internal response to this competitive game segment.
Yalla Group Limited (YALA) - Porter's Five Forces: Threat of new entrants
The threat of new entrants for Yalla Group Limited is best characterized as moderate. This assessment balances the high rewards offered by the market against the substantial, though not insurmountable, barriers to entry that a new competitor must overcome.
The primary draw for any potential entrant is the demonstrated profitability of the established market leader. Yalla Group Limited posted a Net Margin of 45.4% in the third quarter of 2025. This level of profitability signals a highly lucrative environment, which naturally attracts outside attention, especially given the company's reported average Monthly Active Users (MAUs) reached 43.4 million in Q3 2025.
However, achieving that scale requires significant capital outlay, defintely. Building a network effect that rivals Yalla Group Limited's base of 43.4 million MAUs necessitates substantial investment in user acquisition. To put the scale of this capital requirement into perspective, general industry data for mobile gaming CPI (Cost Per Install) in 2024 ranged from approximately $1.50 to $6.00 per user, depending on the game genre and platform. If a new entrant aimed to acquire even a fraction of Yalla Group Limited's user base using these figures, the initial marketing spend would be in the tens of millions of US dollars. Furthermore, industry data suggests the average Customer Acquisition Cost (CAC) has been trending upward, with some reports indicating a recent average CAC hitting around $29 per user. This high cost of entry for scale acts as a major capital barrier.
Beyond direct capital expenditure, Yalla Group Limited has cultivated a high non-capital barrier through deep cultural and language localization, which is a core strength in the MENA region. A new foreign firm must overcome significant hurdles to resonate authentically with the local user base. For instance, market analysis shows that approximately 54% of Google searches in the MENA region are conducted in Arabic. Moreover, in key markets like the UAE, businesses face legal requirements to offer information in Arabic, covering everything from product descriptions to customer service communications. Successfully navigating this requires more than simple translation; it demands nuanced cultural integration, which is time-consuming and costly to build from scratch, especially when competing against an incumbent with years of localized content and community building.
The high barriers to entry can be summarized by the necessary investments and local expertise required:
- Significant capital for user acquisition campaigns.
- Building a network effect of over 43.4 million MAUs.
- Mastering complex cultural and language localization.
- Navigating regional regulatory fragmentation.
The financial metrics supporting the high reward potential are clear:
| Metric | Value (Q3 2025) | Source Context |
|---|---|---|
| Net Income | US$40.7 million | 3.9% increase year-over-year. |
| Net Margin | 45.4% | Indicates strong operational efficiency. |
| Average MAUs | 43.4 million | Represents the established network size. |
| Chatting Services Revenue | US$55.5 million | Primary revenue stream. |
Disclaimer
All information, articles, and product details provided on this website are for general informational and educational purposes only. We do not claim any ownership over, nor do we intend to infringe upon, any trademarks, copyrights, logos, brand names, or other intellectual property mentioned or depicted on this site. Such intellectual property remains the property of its respective owners, and any references here are made solely for identification or informational purposes, without implying any affiliation, endorsement, or partnership.
We make no representations or warranties, express or implied, regarding the accuracy, completeness, or suitability of any content or products presented. Nothing on this website should be construed as legal, tax, investment, financial, medical, or other professional advice. In addition, no part of this site—including articles or product references—constitutes a solicitation, recommendation, endorsement, advertisement, or offer to buy or sell any securities, franchises, or other financial instruments, particularly in jurisdictions where such activity would be unlawful.
All content is of a general nature and may not address the specific circumstances of any individual or entity. It is not a substitute for professional advice or services. Any actions you take based on the information provided here are strictly at your own risk. You accept full responsibility for any decisions or outcomes arising from your use of this website and agree to release us from any liability in connection with your use of, or reliance upon, the content or products found herein.