
|
Yiren Digital Ltd. (YRD) Valation DCF |
Entièrement Modifiable: Adapté À Vos Besoins Dans Excel Ou Sheets
Conception Professionnelle: Modèles Fiables Et Conformes Aux Normes Du Secteur
Pré-Construits Pour Une Utilisation Rapide Et Efficace
Compatible MAC/PC, entièrement débloqué
Aucune Expertise N'Est Requise; Facile À Suivre
Yiren Digital Ltd. (YRD) Bundle
Découvrez le véritable potentiel de Yiren Digital Ltd. (YRD) avec notre calculatrice avancée DCF! Ajustez les hypothèses clés, explorez divers scénarios et évaluez comment les différents changements affectent l'évaluation de Yiren Digital Ltd. (YRD) - le tout dans un seul modèle Excel.
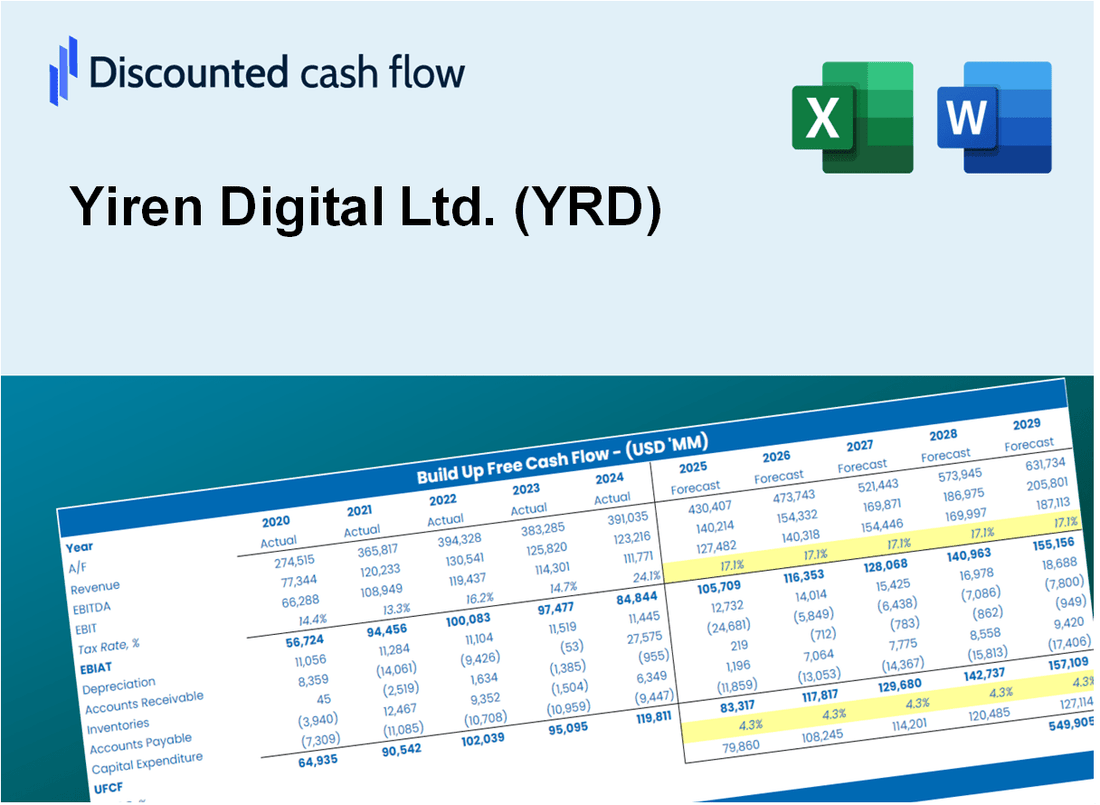
Discounted Cash Flow (DCF) - (USD MM)
| Year | AY1 2020 |
AY2 2021 |
AY3 2022 |
AY4 2023 |
AY5 2024 |
FY1 2025 |
FY2 2026 |
FY3 2027 |
FY4 2028 |
FY5 2029 |
|---|---|---|---|---|---|---|---|---|---|---|
| Revenue | 556.8 | 629.3 | 482.7 | 688.0 | 815.9 | 919.6 | 1,036.5 | 1,168.3 | 1,316.9 | 1,484.3 |
| Revenue Growth, % | 0 | 13.02 | -23.3 | 42.54 | 18.59 | 12.71 | 12.71 | 12.71 | 12.71 | 12.71 |
| EBITDA | 39.0 | 187.0 | 214.3 | 365.6 | 235.4 | 300.0 | 338.1 | 381.1 | 429.6 | 484.2 |
| EBITDA, % | 7 | 29.71 | 44.39 | 53.15 | 28.86 | 32.62 | 32.62 | 32.62 | 32.62 | 32.62 |
| Depreciation | 46.0 | 6.1 | 7.4 | 1.0 | 4.0 | 21.0 | 23.6 | 26.6 | 30.0 | 33.8 |
| Depreciation, % | 8.27 | 0.96554 | 1.54 | 0.14535 | 0.48721 | 2.28 | 2.28 | 2.28 | 2.28 | 2.28 |
| EBIT | -7.0 | 180.9 | 206.8 | 364.6 | 231.5 | 279.0 | 314.5 | 354.5 | 399.6 | 450.4 |
| EBIT, % | -1.26 | 28.75 | 42.85 | 53 | 28.37 | 30.34 | 30.34 | 30.34 | 30.34 | 30.34 |
| Total Cash | 371.8 | 427.5 | 737.0 | 886.1 | 600.3 | 750.9 | 846.4 | 954.0 | 1,075.3 | 1,212.0 |
| Total Cash, percent | .0 | .0 | .0 | .0 | .0 | .0 | .0 | .0 | .0 | .0 |
| Account Receivables | 367.9 | 428.0 | 119.0 | 305.6 | 691.2 | 529.5 | 596.8 | 672.7 | 758.2 | 854.6 |
| Account Receivables, % | 66.08 | 68.02 | 24.66 | 44.41 | 84.71 | 57.58 | 57.58 | 57.58 | 57.58 | 57.58 |
| Inventories | .0 | -35.1 | .0 | .0 | .0 | -10.2 | -11.5 | -13.0 | -14.7 | -16.5 |
| Inventories, % | 0 | -5.57 | 0 | 0 | 0 | -1.11 | -1.11 | -1.11 | -1.11 | -1.11 |
| Accounts Payable | 1.4 | 2.7 | 2.0 | 4.3 | 6.1 | 4.5 | 5.1 | 5.8 | 6.5 | 7.3 |
| Accounts Payable, % | 0.24995 | 0.42575 | 0.41181 | 0.63122 | 0.7435 | 0.49245 | 0.49245 | 0.49245 | 0.49245 | 0.49245 |
| Capital Expenditure | -1.9 | -1.3 | -.1 | -.6 | -1.3 | -1.5 | -1.7 | -1.9 | -2.2 | -2.5 |
| Capital Expenditure, % | -0.34634 | -0.21001 | -0.0256797 | -0.09077478 | -0.15827 | -0.16622 | -0.16622 | -0.16622 | -0.16622 | -0.16622 |
| Tax Rate, % | 15.02 | 15.02 | 15.02 | 15.02 | 15.02 | 15.02 | 15.02 | 15.02 | 15.02 | 15.02 |
| EBITAT | -6.3 | 155.3 | 165.3 | 286.7 | 196.7 | 233.8 | 263.5 | 297.0 | 334.8 | 377.4 |
| Depreciation | ||||||||||
| Changes in Account Receivables | ||||||||||
| Changes in Inventories | ||||||||||
| Changes in Accounts Payable | ||||||||||
| Capital Expenditure | ||||||||||
| UFCF | -328.7 | 136.3 | 445.8 | 102.9 | -184.5 | 423.6 | 220.0 | 248.0 | 279.5 | 315.0 |
| WACC, % | 7.34 | 7.33 | 7.32 | 7.32 | 7.33 | 7.33 | 7.33 | 7.33 | 7.33 | 7.33 |
| PV UFCF | ||||||||||
| SUM PV UFCF | 1,218.1 | |||||||||
| Long Term Growth Rate, % | 2.00 | |||||||||
| Free cash flow (T + 1) | 321 | |||||||||
| Terminal Value | 6,029 | |||||||||
| Present Terminal Value | 4,233 | |||||||||
| Enterprise Value | 5,451 | |||||||||
| Net Debt | -534 | |||||||||
| Equity Value | 5,985 | |||||||||
| Diluted Shares Outstanding, MM | 22 | |||||||||
| Equity Value Per Share | 274.06 |
What You Will Get
- Real YRD Financials: Access to historical and projected data for precise valuation.
- Customizable Inputs: Adjust WACC, tax rates, revenue growth, and capital expenditures as needed.
- Dynamic Calculations: Intrinsic value and NPV are computed automatically.
- Scenario Analysis: Evaluate various scenarios to assess Yiren Digital Ltd.'s future performance.
- User-Friendly Design: Designed for professionals while remaining approachable for newcomers.
Key Features
- Real-Time YRD Data: Pre-loaded with Yiren Digital Ltd.'s historical performance metrics and future projections.
- Customizable Parameters: Modify revenue growth rates, profit margins, discount rates, tax implications, and capital investments.
- Interactive Valuation Model: Instant updates to Net Present Value (NPV) and intrinsic value based on user-defined inputs.
- Scenario Analysis: Develop various forecasting scenarios to evaluate different valuation possibilities.
- Intuitive Interface: Designed for ease of use, catering to both seasoned professionals and newcomers.
How It Works
- 1. Access the Model: Download and open the Excel file containing Yiren Digital Ltd.'s (YRD) preloaded financial data.
- 2. Adjust Parameters: Modify essential inputs such as revenue growth rates, discount rates, and investment expenditures.
- 3. Analyze Results Immediately: The DCF model automatically computes the intrinsic value and net present value (NPV) for you.
- 4. Explore Scenarios: Evaluate various projections to understand different valuation possibilities.
- 5. Present with Assurance: Share expert valuation analyses to enhance your strategic decisions.
Why Choose This Calculator for Yiren Digital Ltd. (YRD)?
- User-Friendly Interface: Tailored for both novices and seasoned professionals.
- Customizable Inputs: Adjust parameters easily to suit your specific analysis needs.
- Real-Time Feedback: Observe immediate changes in Yiren Digital's valuation as you modify inputs.
- Pre-Configured Data: Comes with Yiren Digital's actual financial information for swift evaluations.
- Relied Upon by Experts: Employed by analysts and investors to guide strategic decisions.
Who Should Use This Product?
- Investors: Assess Yiren Digital Ltd.’s (YRD) intrinsic value to inform investment choices.
- CFOs: Utilize a sophisticated DCF model for accurate financial reporting and analysis.
- Consultants: Efficiently customize the template for client valuation reports.
- Entrepreneurs: Discover financial modeling techniques employed by leading tech firms.
- Educators: Implement it as a resource to teach valuation strategies and concepts.
What the Template Contains
- Pre-Filled DCF Model: Yiren Digital Ltd.'s (YRD) financial data preloaded for immediate use.
- WACC Calculator: Detailed calculations for Weighted Average Cost of Capital.
- Financial Ratios: Evaluate Yiren Digital Ltd.'s (YRD) profitability, leverage, and efficiency.
- Editable Inputs: Change assumptions such as growth, margins, and CAPEX to fit your scenarios.
- Financial Statements: Annual and quarterly reports to support detailed analysis.
- Interactive Dashboard: Easily visualize key valuation metrics and results.
Disclaimer
All information, articles, and product details provided on this website are for general informational and educational purposes only. We do not claim any ownership over, nor do we intend to infringe upon, any trademarks, copyrights, logos, brand names, or other intellectual property mentioned or depicted on this site. Such intellectual property remains the property of its respective owners, and any references here are made solely for identification or informational purposes, without implying any affiliation, endorsement, or partnership.
We make no representations or warranties, express or implied, regarding the accuracy, completeness, or suitability of any content or products presented. Nothing on this website should be construed as legal, tax, investment, financial, medical, or other professional advice. In addition, no part of this site—including articles or product references—constitutes a solicitation, recommendation, endorsement, advertisement, or offer to buy or sell any securities, franchises, or other financial instruments, particularly in jurisdictions where such activity would be unlawful.
All content is of a general nature and may not address the specific circumstances of any individual or entity. It is not a substitute for professional advice or services. Any actions you take based on the information provided here are strictly at your own risk. You accept full responsibility for any decisions or outcomes arising from your use of this website and agree to release us from any liability in connection with your use of, or reliance upon, the content or products found herein.