
|
Joyy Inc. (YY) Évaluation DCF |
Entièrement Modifiable: Adapté À Vos Besoins Dans Excel Ou Sheets
Conception Professionnelle: Modèles Fiables Et Conformes Aux Normes Du Secteur
Pré-Construits Pour Une Utilisation Rapide Et Efficace
Compatible MAC/PC, entièrement débloqué
Aucune Expertise N'Est Requise; Facile À Suivre
JOYY Inc. (YY) Bundle
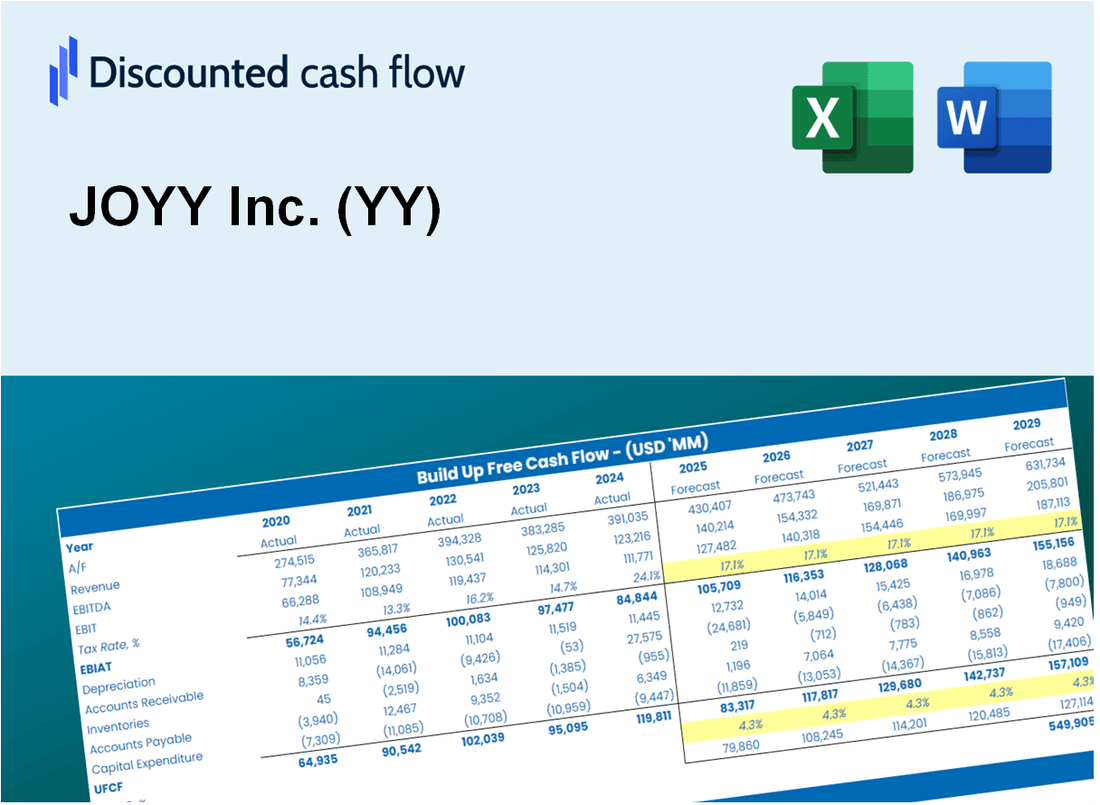
Découvrez la vraie valeur de Joyy Inc. (YY) avec notre calculatrice DCF de qualité professionnelle! Ajustez les hypothèses clés, explorez divers scénarios et évaluez comment les changements affectent la valorisation de Joyy Inc. (YY) - le tout dans un seul modèle Excel.
Discounted Cash Flow (DCF) - (USD MM)
| Year | AY1 2020 |
AY2 2021 |
AY3 2022 |
AY4 2023 |
AY5 2024 |
FY1 2025 |
FY2 2026 |
FY3 2027 |
FY4 2028 |
FY5 2029 |
|---|---|---|---|---|---|---|---|---|---|---|
| Revenue | 2,025.2 | 2,619.1 | 2,411.5 | 2,267.9 | 2,237.8 | 2,316.8 | 2,398.6 | 2,483.2 | 2,570.9 | 2,661.6 |
| Revenue Growth, % | 0 | 29.33 | -7.92 | -5.96 | -1.33 | 3.53 | 3.53 | 3.53 | 3.53 | 3.53 |
| EBITDA | 292.6 | 119.8 | 158.7 | 422.4 | 167.6 | 239.7 | 248.1 | 256.9 | 265.9 | 275.3 |
| EBITDA, % | 14.45 | 4.57 | 6.58 | 18.63 | 7.49 | 10.34 | 10.34 | 10.34 | 10.34 | 10.34 |
| Depreciation | 203.4 | 182.9 | 163.4 | 124.0 | 120.0 | 160.5 | 166.1 | 172.0 | 178.1 | 184.4 |
| Depreciation, % | 10.04 | 6.98 | 6.77 | 5.47 | 5.36 | 6.93 | 6.93 | 6.93 | 6.93 | 6.93 |
| EBIT | 89.2 | -63.1 | -4.7 | 298.4 | 47.7 | 79.2 | 82.0 | 84.9 | 87.9 | 91.0 |
| EBIT, % | 4.41 | -2.41 | -0.19349 | 13.16 | 2.13 | 3.42 | 3.42 | 3.42 | 3.42 | 3.42 |
| Total Cash | 3,552.3 | 4,387.9 | 3,937.6 | 3,685.6 | 1,809.7 | 2,228.1 | 2,306.8 | 2,388.2 | 2,472.5 | 2,559.8 |
| Total Cash, percent | .0 | .0 | .0 | .0 | .0 | .0 | .0 | .0 | .0 | .0 |
| Account Receivables | 212.8 | 273.8 | 230.4 | 291.7 | 122.3 | 226.3 | 234.3 | 242.6 | 251.2 | 260.0 |
| Account Receivables, % | 10.51 | 10.45 | 9.55 | 12.86 | 5.47 | 9.77 | 9.77 | 9.77 | 9.77 | 9.77 |
| Inventories | 97.6 | 297.3 | 351.1 | 2.1 | .0 | 142.8 | 147.9 | 153.1 | 158.5 | 164.1 |
| Inventories, % | 4.82 | 11.35 | 14.56 | 0.09462624 | 0 | 6.17 | 6.17 | 6.17 | 6.17 | 6.17 |
| Accounts Payable | 21.0 | 18.0 | 56.0 | 66.8 | 100.7 | 53.2 | 55.1 | 57.1 | 59.1 | 61.2 |
| Accounts Payable, % | 1.03 | 0.68769 | 2.32 | 2.94 | 4.5 | 2.3 | 2.3 | 2.3 | 2.3 | 2.3 |
| Capital Expenditure | -161.8 | -184.9 | -69.2 | -82.0 | .0 | -99.8 | -103.3 | -107.0 | -110.7 | -114.6 |
| Capital Expenditure, % | -7.99 | -7.06 | -2.87 | -3.62 | 0 | -4.31 | -4.31 | -4.31 | -4.31 | -4.31 |
| Tax Rate, % | 35.97 | 35.97 | 35.97 | 35.97 | 35.97 | 35.97 | 35.97 | 35.97 | 35.97 | 35.97 |
| EBITAT | -56.5 | -84.1 | -4.4 | 312.7 | 30.5 | 56.8 | 58.8 | 60.9 | 63.0 | 65.2 |
| Depreciation | ||||||||||
| Changes in Account Receivables | ||||||||||
| Changes in Inventories | ||||||||||
| Changes in Accounts Payable | ||||||||||
| Capital Expenditure | ||||||||||
| UFCF | -304.5 | -349.6 | 117.4 | 653.1 | 356.0 | -176.9 | 110.5 | 114.4 | 118.4 | 122.6 |
| WACC, % | 5.06 | 5.11 | 5.1 | 5.11 | 5.09 | 5.09 | 5.09 | 5.09 | 5.09 | 5.09 |
| PV UFCF | ||||||||||
| SUM PV UFCF | 222.9 | |||||||||
| Long Term Growth Rate, % | 2.00 | |||||||||
| Free cash flow (T + 1) | 125 | |||||||||
| Terminal Value | 4,042 | |||||||||
| Present Terminal Value | 3,153 | |||||||||
| Enterprise Value | 3,376 | |||||||||
| Net Debt | -414 | |||||||||
| Equity Value | 3,789 | |||||||||
| Diluted Shares Outstanding, MM | 58 | |||||||||
| Equity Value Per Share | 65.46 |
What You Will Get
- Editable Forecast Inputs: Easily modify assumptions (growth %, margins, WACC) to explore various scenarios.
- Real-World Data: JOYY Inc.’s (YY) financial data pre-loaded to streamline your analysis.
- Automatic DCF Outputs: The template computes Net Present Value (NPV) and intrinsic value automatically.
- Customizable and Professional: A refined Excel model that adjusts to your valuation requirements.
- Built for Analysts and Investors: Perfect for testing forecasts, validating strategies, and enhancing efficiency.
Key Features
- Comprehensive DCF Calculator: Features detailed unlevered and levered DCF valuation models tailored for JOYY Inc. (YY).
- WACC Calculator: Pre-configured Weighted Average Cost of Capital sheet with adjustable inputs for precise calculations.
- Customizable Forecast Assumptions: Adjust growth rates, capital expenditures, and discount rates to fit your analysis.
- Integrated Financial Ratios: Evaluate profitability, leverage, and efficiency ratios specifically for JOYY Inc. (YY).
- Interactive Dashboard and Charts: Visual representations summarize essential valuation metrics for straightforward analysis.
How It Works
- Step 1: Download the prebuilt Excel template with JOYY Inc.'s (YY) data included.
- Step 2: Explore the pre-filled sheets and familiarize yourself with the key metrics.
- Step 3: Update forecasts and assumptions in the editable yellow cells (WACC, growth, margins).
- Step 4: Instantly view recalculated results, including JOYY Inc.'s (YY) intrinsic value.
- Step 5: Make informed investment decisions or generate reports using the outputs.
Why Choose JOYY Inc. (YY)?
- Diverse Offerings: A wide range of platforms catering to different user needs and preferences.
- Strong Growth Potential: Consistent expansion in user base and revenue streams enhances investment opportunities.
- Innovative Technology: Cutting-edge features and tools that keep JOYY ahead in the digital landscape.
- Global Reach: A robust international presence that opens doors to various markets.
- Backed by Expertise: A team of seasoned professionals dedicated to driving success and value.
Who Should Use This Product?
- Investors: Accurately assess JOYY Inc.'s (YY) fair value prior to making investment choices.
- CFOs: Utilize a professional-grade DCF model for financial reporting and analysis specific to JOYY Inc. (YY).
- Consultants: Efficiently customize the template for valuation reports tailored to JOYY Inc. (YY) clients.
- Entrepreneurs: Acquire insights into financial modeling practices employed by leading companies like JOYY Inc. (YY).
- Educators: Implement it as a teaching resource to illustrate valuation methodologies relevant to JOYY Inc. (YY).
What the Template Contains
- Preloaded YY Data: Historical and projected financial data, including revenue, EBIT, and capital expenditures.
- DCF and WACC Models: Professional-grade sheets for calculating intrinsic value and Weighted Average Cost of Capital.
- Editable Inputs: Yellow-highlighted cells for adjusting revenue growth, tax rates, and discount rates.
- Financial Statements: Comprehensive annual and quarterly financials for deeper analysis.
- Key Ratios: Profitability, leverage, and efficiency ratios to evaluate performance.
- Dashboard and Charts: Visual summaries of valuation outcomes and assumptions.
Disclaimer
All information, articles, and product details provided on this website are for general informational and educational purposes only. We do not claim any ownership over, nor do we intend to infringe upon, any trademarks, copyrights, logos, brand names, or other intellectual property mentioned or depicted on this site. Such intellectual property remains the property of its respective owners, and any references here are made solely for identification or informational purposes, without implying any affiliation, endorsement, or partnership.
We make no representations or warranties, express or implied, regarding the accuracy, completeness, or suitability of any content or products presented. Nothing on this website should be construed as legal, tax, investment, financial, medical, or other professional advice. In addition, no part of this site—including articles or product references—constitutes a solicitation, recommendation, endorsement, advertisement, or offer to buy or sell any securities, franchises, or other financial instruments, particularly in jurisdictions where such activity would be unlawful.
All content is of a general nature and may not address the specific circumstances of any individual or entity. It is not a substitute for professional advice or services. Any actions you take based on the information provided here are strictly at your own risk. You accept full responsibility for any decisions or outcomes arising from your use of this website and agree to release us from any liability in connection with your use of, or reliance upon, the content or products found herein.