
|
Zensar Technologies Limited (Zensartech.NS) Évaluation DCF |
Entièrement Modifiable: Adapté À Vos Besoins Dans Excel Ou Sheets
Conception Professionnelle: Modèles Fiables Et Conformes Aux Normes Du Secteur
Pré-Construits Pour Une Utilisation Rapide Et Efficace
Compatible MAC/PC, entièrement débloqué
Aucune Expertise N'Est Requise; Facile À Suivre
Zensar Technologies Limited (ZENSARTECH.NS) Bundle
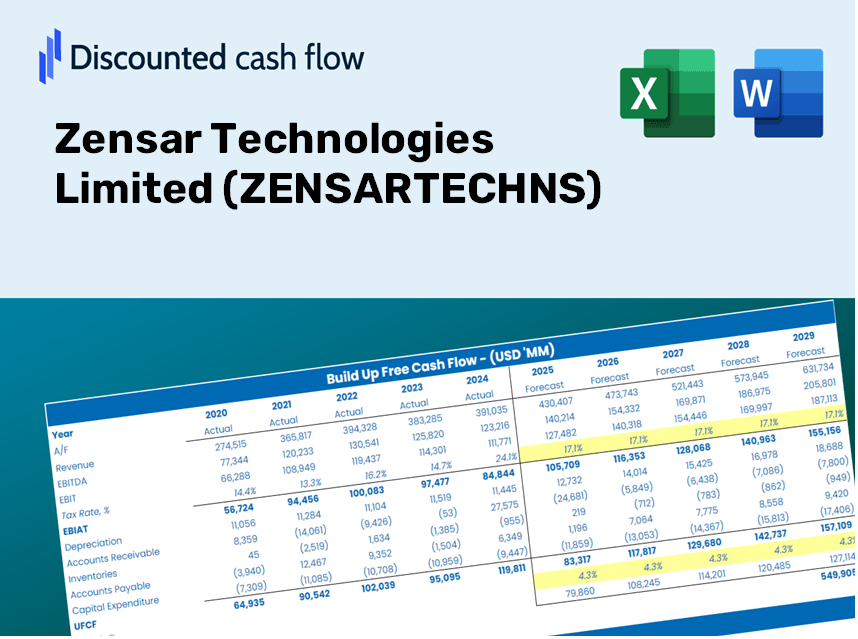
Gardez un aperçu de votre analyse d'évaluation de votre Zensar Technologies Limited (Zensartechns) avec notre calculatrice DCF de pointe! Ce modèle Excel, préchargé avec des données réelles (Zensartechns), vous permet d'ajuster les prévisions et les hypothèses pour déterminer la valeur intrinsèque des technologies Zensar limitées avec précision.
Benefits You Will Receive
- Comprehensive ZENSARTECHNS Financials: Access to historical and projected data for precise valuation.
- Customizable Parameters: Adjust WACC, tax rates, revenue growth, and capital expenditures to fit your analysis.
- Real-Time Calculations: Intrinsic value and NPV are computed automatically.
- Scenario Simulations: Explore various scenarios to assess Zensar's potential future performance.
- User-Friendly Interface: Designed for experienced professionals while remaining accessible to newcomers.
Key Features
- Comprehensive Historical Data: Access Zensar Technologies Limited’s (ZENSARTECHNS) financial statements and detailed forecasts.
- Customizable Parameters: Modify inputs such as WACC, tax rates, revenue growth, and EBITDA margins as needed.
- Real-Time Calculations: Instantly view the recalculated intrinsic value for Zensar Technologies Limited (ZENSARTECHNS).
- Insightful Visualizations: Interactive dashboards present valuation results and essential metrics clearly.
- Designed for Precision: A reliable resource for analysts, investors, and finance professionals.
How It Works
- Step 1: Download the Excel file for Zensar Technologies Limited (ZENSARTECHNS).
- Step 2: Examine the pre-filled financial data and forecasts specific to Zensar Technologies.
- Step 3: Adjust key inputs such as revenue growth, WACC, and tax rates (highlighted cells).
- Step 4: Observe the DCF model refresh in real-time as you modify your assumptions.
- Step 5: Evaluate the outputs and leverage the results for your investment strategies.
Why Opt for This Calculator?
- Precise Data: Utilize authentic Zensar Technologies Limited financials for dependable valuation outcomes.
- Fully Customizable: Modify essential parameters such as growth rates, WACC, and tax rates to align with your forecasts.
- Efficient: Integrated calculations save you the hassle of building from the ground up.
- Professional-Quality Tool: Tailored for investors, analysts, and consultants working with ZENSARTECHNS.
- User-Friendly Design: An intuitive interface with clear, step-by-step guidance makes it accessible for everyone.
Who Can Benefit from This Product?
- Finance Students: Master valuation methods and apply them using real-time data.
- Academics: Integrate industry-standard models into your research or teaching materials.
- Investors: Validate your investment hypotheses and assess valuation scenarios for Zensar Technologies Limited (ZENSARTECHNS).
- Analysts: Enhance your productivity with a ready-to-use, customizable DCF model.
- Small Business Owners: Discover how major public companies, like Zensar Technologies Limited (ZENSARTECHNS), are evaluated.
Contents of the Template
- Pre-Filled DCF Model: Zensar Technologies Limited's financial data preloaded for immediate use.
- WACC Calculator: Comprehensive calculations for Weighted Average Cost of Capital.
- Financial Ratios: Assess Zensar's profitability, leverage, and efficiency metrics.
- Editable Inputs: Modify assumptions like growth rates, margins, and CAPEX to suit your scenarios.
- Financial Statements: Access annual and quarterly reports for in-depth analysis.
- Interactive Dashboard: Effortlessly visualize essential valuation metrics and outcomes.
Disclaimer
All information, articles, and product details provided on this website are for general informational and educational purposes only. We do not claim any ownership over, nor do we intend to infringe upon, any trademarks, copyrights, logos, brand names, or other intellectual property mentioned or depicted on this site. Such intellectual property remains the property of its respective owners, and any references here are made solely for identification or informational purposes, without implying any affiliation, endorsement, or partnership.
We make no representations or warranties, express or implied, regarding the accuracy, completeness, or suitability of any content or products presented. Nothing on this website should be construed as legal, tax, investment, financial, medical, or other professional advice. In addition, no part of this site—including articles or product references—constitutes a solicitation, recommendation, endorsement, advertisement, or offer to buy or sell any securities, franchises, or other financial instruments, particularly in jurisdictions where such activity would be unlawful.
All content is of a general nature and may not address the specific circumstances of any individual or entity. It is not a substitute for professional advice or services. Any actions you take based on the information provided here are strictly at your own risk. You accept full responsibility for any decisions or outcomes arising from your use of this website and agree to release us from any liability in connection with your use of, or reliance upon, the content or products found herein.