
|
ZF Commercial Vehicle Control Systems India Limited (ZFCVindia.NS) Évaluation DCF |
Entièrement Modifiable: Adapté À Vos Besoins Dans Excel Ou Sheets
Conception Professionnelle: Modèles Fiables Et Conformes Aux Normes Du Secteur
Pré-Construits Pour Une Utilisation Rapide Et Efficace
Compatible MAC/PC, entièrement débloqué
Aucune Expertise N'Est Requise; Facile À Suivre
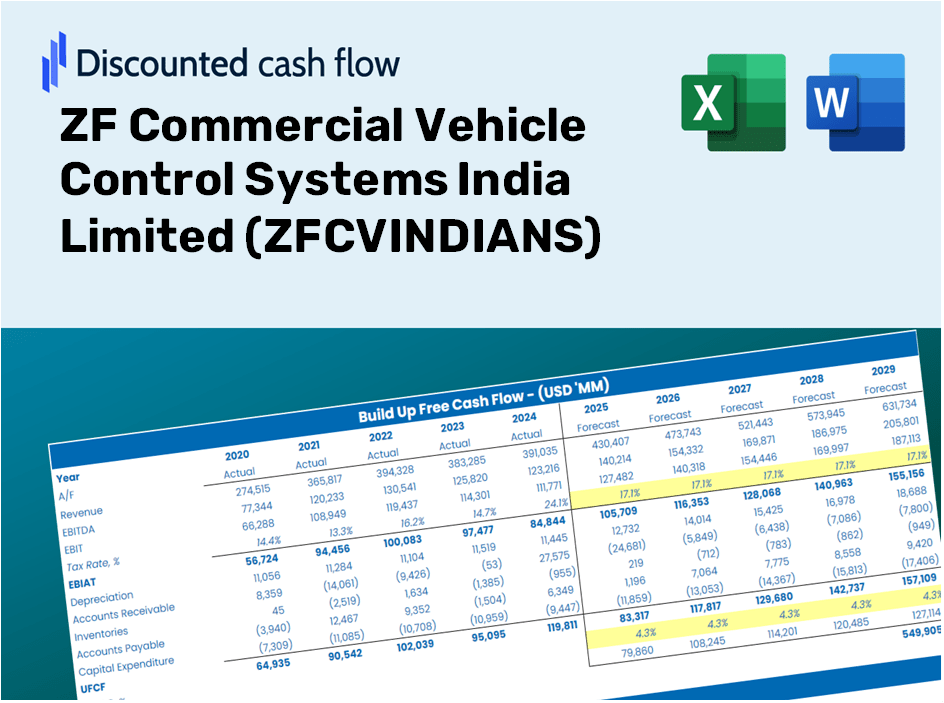
ZF Commercial Vehicle Control Systems India Limited (ZFCVINDIA.NS) Bundle
Optimisez votre temps et améliorez la précision avec notre calculatrice DCF (ZFCVindians)! Équipée de données authentiques de ZF Commercial Vehicle Control Systems India Limited et personnalisables, cet outil vous permet de prévoir, analyser et valoriser (ZFCVindians) comme un investisseur chevronné.
Discounted Cash Flow (DCF) - (USD MM)
| Year | AY1 2021 |
AY2 2022 |
AY3 2023 |
AY4 2024 |
AY5 2025 |
FY1 2026 |
FY2 2027 |
FY3 2028 |
FY4 2029 |
FY5 2030 |
|---|---|---|---|---|---|---|---|---|---|---|
| Revenue | 18,398.0 | 25,220.2 | 34,162.0 | 37,844.3 | 38,309.6 | 46,406.8 | 56,215.4 | 68,097.1 | 82,490.2 | 99,925.5 |
| Revenue Growth, % | 0 | 37.08 | 35.45 | 10.78 | 1.23 | 21.14 | 21.14 | 21.14 | 21.14 | 21.14 |
| EBITDA | 2,446.6 | 2,900.8 | 5,373.4 | 6,612.2 | 7,392.8 | 7,174.3 | 8,690.7 | 10,527.6 | 12,752.7 | 15,448.1 |
| EBITDA, % | 13.3 | 11.5 | 15.73 | 17.47 | 19.3 | 15.46 | 15.46 | 15.46 | 15.46 | 15.46 |
| Depreciation | 904.0 | 924.3 | 1,047.8 | 1,098.0 | 1,242.5 | 1,651.2 | 2,000.2 | 2,422.9 | 2,935.0 | 3,555.4 |
| Depreciation, % | 4.91 | 3.66 | 3.07 | 2.9 | 3.24 | 3.56 | 3.56 | 3.56 | 3.56 | 3.56 |
| EBIT | 1,542.6 | 1,976.4 | 4,325.6 | 5,514.2 | 6,150.2 | 5,523.2 | 6,690.5 | 8,104.7 | 9,817.7 | 11,892.7 |
| EBIT, % | 8.38 | 7.84 | 12.66 | 14.57 | 16.05 | 11.9 | 11.9 | 11.9 | 11.9 | 11.9 |
| Total Cash | 10,967.6 | 10,619.4 | 12,653.6 | 13,198.3 | 14,961.7 | 19,740.5 | 23,912.8 | 28,967.1 | 35,089.6 | 42,506.2 |
| Total Cash, percent | .0 | .0 | .0 | .0 | .0 | .0 | .0 | .0 | .0 | .0 |
| Account Receivables | 6,319.3 | 252.1 | 7,621.2 | 246.0 | 11,206.3 | 8,126.6 | 9,844.2 | 11,924.9 | 14,445.3 | 17,498.5 |
| Account Receivables, % | 34.35 | 0.99959 | 22.31 | 0.65 | 29.25 | 17.51 | 17.51 | 17.51 | 17.51 | 17.51 |
| Inventories | 1,137.2 | 1,447.7 | 1,569.6 | 1,753.4 | 1,905.7 | 2,424.6 | 2,937.1 | 3,557.9 | 4,309.9 | 5,220.8 |
| Inventories, % | 6.18 | 5.74 | 4.59 | 4.63 | 4.97 | 5.22 | 5.22 | 5.22 | 5.22 | 5.22 |
| Accounts Payable | 3,420.3 | 3,462.0 | 3,599.7 | 3,829.2 | 3,512.1 | 5,767.5 | 6,986.6 | 8,463.3 | 10,252.1 | 12,419.0 |
| Accounts Payable, % | 18.59 | 13.73 | 10.54 | 10.12 | 9.17 | 12.43 | 12.43 | 12.43 | 12.43 | 12.43 |
| Capital Expenditure | -700.7 | -1,763.1 | -1,278.2 | -1,983.2 | -1,663.5 | -2,239.0 | -2,712.3 | -3,285.5 | -3,980.0 | -4,821.2 |
| Capital Expenditure, % | -3.81 | -6.99 | -3.74 | -5.24 | -4.34 | -4.82 | -4.82 | -4.82 | -4.82 | -4.82 |
| Tax Rate, % | 24.39 | 24.39 | 24.39 | 24.39 | 24.39 | 24.39 | 24.39 | 24.39 | 24.39 | 24.39 |
| EBITAT | 1,051.6 | 1,434.5 | 3,218.9 | 4,101.6 | 4,650.4 | 4,033.7 | 4,886.3 | 5,919.1 | 7,170.2 | 8,685.7 |
| Depreciation | ||||||||||
| Changes in Account Receivables | ||||||||||
| Changes in Inventories | ||||||||||
| Changes in Accounts Payable | ||||||||||
| Capital Expenditure | ||||||||||
| UFCF | -2,781.2 | 6,394.0 | -4,364.8 | 10,637.2 | -7,200.2 | 8,262.2 | 3,163.1 | 3,831.7 | 4,641.6 | 5,622.6 |
| WACC, % | 4.69 | 4.69 | 4.69 | 4.69 | 4.69 | 4.69 | 4.69 | 4.69 | 4.69 | 4.69 |
| PV UFCF | ||||||||||
| SUM PV UFCF | 22,453.7 | |||||||||
| Long Term Growth Rate, % | 4.00 | |||||||||
| Free cash flow (T + 1) | 5,848 | |||||||||
| Terminal Value | 849,398 | |||||||||
| Present Terminal Value | 675,488 | |||||||||
| Enterprise Value | 697,942 | |||||||||
| Net Debt | -14,015 | |||||||||
| Equity Value | 711,957 | |||||||||
| Diluted Shares Outstanding, MM | 19 | |||||||||
| Equity Value Per Share | 37,534.65 |
What You Will Receive
- Genuine ZF Data: Comprehensive financials – covering metrics such as revenue and EBIT – derived from actual and projected figures.
- Complete Customization: Modify all key parameters (highlighted cells) including WACC, growth %, and tax rates.
- Real-Time Valuation Updates: Automatic recalculations to assess the effects of adjustments on ZF's fair value.
- Flexible Excel Template: Designed for quick modifications, scenario analysis, and in-depth forecasting.
- Efficient and Precise: Eliminate the need to create models from the ground up while ensuring accuracy and adaptability.
Key Features
- Comprehensive DCF Calculator: Features detailed unlevered and levered DCF valuation frameworks.
- WACC Calculator: Pre-configured Weighted Average Cost of Capital sheet with adjustable inputs.
- Customizable Forecast Assumptions: Adjust growth rates, capital expenditures, and discount rates as needed.
- Integrated Financial Ratios: Evaluate profitability, leverage, and efficiency ratios for ZF Commercial Vehicle Control Systems India Limited (ZFCVINDIANS).
- Interactive Dashboard and Charts: Visual presentations that summarize critical valuation metrics for streamlined analysis.
How It Works
- Step 1: Download the Excel file for ZF Commercial Vehicle Control Systems India Limited (ZFCVINDIANS).
- Step 2: Review the pre-filled data for ZFCVINDIANS (historical and projected).
- Step 3: Modify the key assumptions (yellow cells) based on your analysis.
- Step 4: Observe the automatic recalculations for the intrinsic value of ZFCVINDIANS.
- Step 5: Utilize the results for making investment decisions or for reporting purposes.
Why Opt for This Calculator?
- Reliable Data: Accurate financial insights from ZF Commercial Vehicle Control Systems India Limited (ZFCVINDIANS) provide trustworthy valuation outcomes.
- Adaptable: Tailor key metrics such as growth rates, WACC, and tax rates to fit your financial forecasts.
- Time-Efficient: Pre-configured calculations save you the effort of building models from the ground up.
- Professional-Quality Tool: Crafted for investors, analysts, and consultants seeking in-depth analysis.
- Easy to Use: User-friendly design and clear, step-by-step guidance ensure accessibility for all users.
Who Can Benefit from This Product?
- Investors: Evaluate ZF Commercial Vehicle Control Systems India Limited’s (ZFCVINDIANS) value before making stock trades.
- CFOs and Financial Analysts: Optimize valuation methodologies and assess future forecasts.
- Startup Founders: Gain insights into how established firms like ZF Commercial Vehicle Control Systems are appraised.
- Consultants: Provide comprehensive valuation reports for your clients’ needs.
- Students and Educators: Apply real-world examples to learn and teach valuation strategies.
Contents of the Template
- Preloaded ZFCVINDIANS Data: Historical and projected financial metrics, including revenue, EBIT, and capital expenditures.
- DCF and WACC Models: Professional-grade spreadsheets designed for calculating intrinsic value and Weighted Average Cost of Capital.
- Editable Inputs: Cells highlighted in yellow for customizing revenue growth, tax rates, and discount rates.
- Financial Statements: Detailed annual and quarterly financial reports for in-depth analysis.
- Key Ratios: Metrics on profitability, leverage, and efficiency for performance assessment.
- Dashboard and Charts: Visual representations of valuation outcomes and underlying assumptions.
Disclaimer
All information, articles, and product details provided on this website are for general informational and educational purposes only. We do not claim any ownership over, nor do we intend to infringe upon, any trademarks, copyrights, logos, brand names, or other intellectual property mentioned or depicted on this site. Such intellectual property remains the property of its respective owners, and any references here are made solely for identification or informational purposes, without implying any affiliation, endorsement, or partnership.
We make no representations or warranties, express or implied, regarding the accuracy, completeness, or suitability of any content or products presented. Nothing on this website should be construed as legal, tax, investment, financial, medical, or other professional advice. In addition, no part of this site—including articles or product references—constitutes a solicitation, recommendation, endorsement, advertisement, or offer to buy or sell any securities, franchises, or other financial instruments, particularly in jurisdictions where such activity would be unlawful.
All content is of a general nature and may not address the specific circumstances of any individual or entity. It is not a substitute for professional advice or services. Any actions you take based on the information provided here are strictly at your own risk. You accept full responsibility for any decisions or outcomes arising from your use of this website and agree to release us from any liability in connection with your use of, or reliance upon, the content or products found herein.