
|
ZK International Group Co., Ltd. (Zkin) Valation DCF |
Entièrement Modifiable: Adapté À Vos Besoins Dans Excel Ou Sheets
Conception Professionnelle: Modèles Fiables Et Conformes Aux Normes Du Secteur
Pré-Construits Pour Une Utilisation Rapide Et Efficace
Compatible MAC/PC, entièrement débloqué
Aucune Expertise N'Est Requise; Facile À Suivre
ZK International Group Co., Ltd. (ZKIN) Bundle
Optimisez votre temps et améliorez la précision avec notre calculatrice Zkin DCF! En utilisant des données réelles de ZK International Group Co., Ltd. et des hypothèses personnalisables, cet outil vous permet de prévoir, d'analyser et d'évaluer ZK International comme un investisseur chevronné.
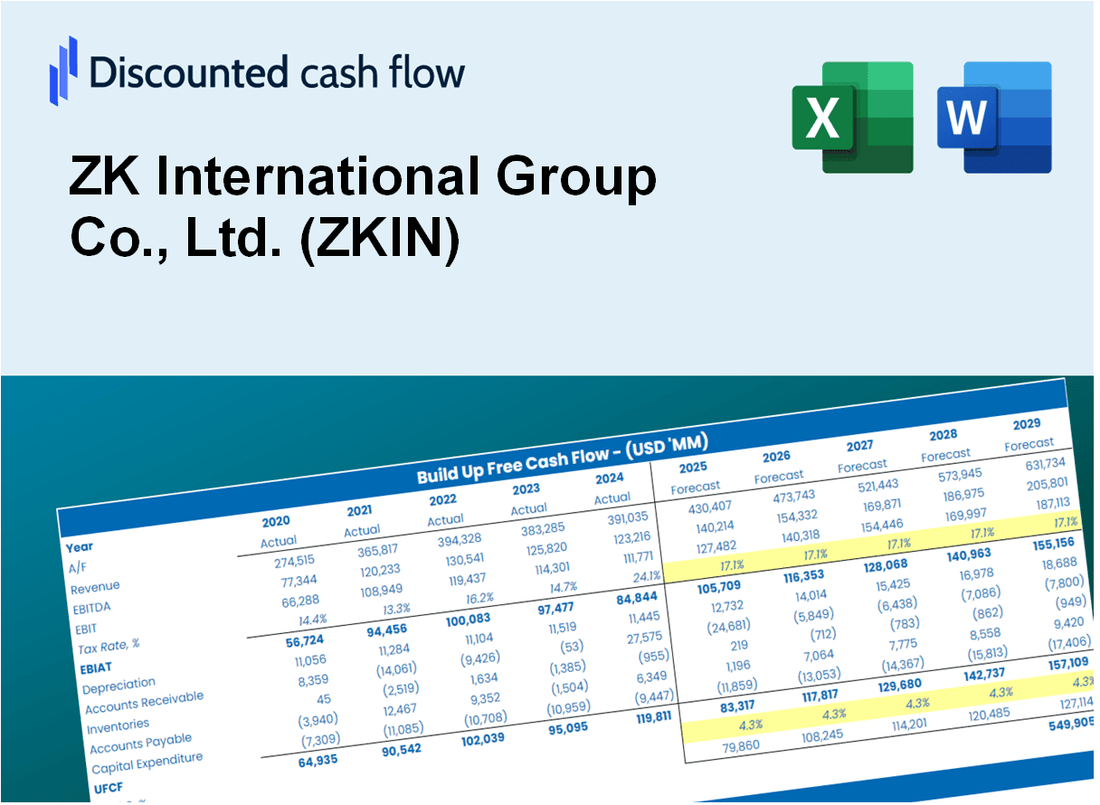
Discounted Cash Flow (DCF) - (USD MM)
| Year | AY1 2020 |
AY2 2021 |
AY3 2022 |
AY4 2023 |
AY5 2024 |
FY1 2025 |
FY2 2026 |
FY3 2027 |
FY4 2028 |
FY5 2029 |
|---|---|---|---|---|---|---|---|---|---|---|
| Revenue | 86.8 | 99.4 | 102.4 | 111.6 | 108.2 | 114.5 | 121.2 | 128.3 | 135.8 | 143.8 |
| Revenue Growth, % | 0 | 14.46 | 3 | 8.99 | -3.05 | 5.85 | 5.85 | 5.85 | 5.85 | 5.85 |
| EBITDA | -.8 | -2.1 | -2.4 | -59.2 | -.7 | -13.5 | -14.3 | -15.2 | -16.1 | -17.0 |
| EBITDA, % | -0.93824 | -2.12 | -2.38 | -53.04 | -0.63719 | -11.82 | -11.82 | -11.82 | -11.82 | -11.82 |
| Depreciation | .4 | 1.0 | 1.5 | 1.0 | .8 | 1.1 | 1.1 | 1.2 | 1.3 | 1.4 |
| Depreciation, % | 0.51796 | 1.06 | 1.47 | 0.87429 | 0.78496 | 0.9402 | 0.9402 | 0.9402 | 0.9402 | 0.9402 |
| EBIT | -1.3 | -3.2 | -3.9 | -60.2 | -1.5 | -14.6 | -15.5 | -16.4 | -17.3 | -18.4 |
| EBIT, % | -1.46 | -3.18 | -3.85 | -53.91 | -1.42 | -12.76 | -12.76 | -12.76 | -12.76 | -12.76 |
| Total Cash | 4.1 | 16.1 | 8.4 | 5.0 | 4.1 | 8.6 | 9.1 | 9.6 | 10.1 | 10.7 |
| Total Cash, percent | .0 | .0 | .0 | .0 | .0 | .0 | .0 | .0 | .0 | .0 |
| Account Receivables | 35.0 | 29.3 | 30.8 | 15.0 | 27.4 | 31.7 | 33.6 | 35.6 | 37.6 | 39.9 |
| Account Receivables, % | 40.27 | 29.46 | 30.05 | 13.46 | 25.33 | 27.71 | 27.71 | 27.71 | 27.71 | 27.71 |
| Inventories | 21.7 | 20.7 | 21.1 | 17.9 | 13.5 | 21.8 | 23.0 | 24.4 | 25.8 | 27.3 |
| Inventories, % | 24.96 | 20.81 | 20.65 | 16.07 | 12.5 | 19 | 19 | 19 | 19 | 19 |
| Accounts Payable | 10.4 | 2.2 | 10.1 | 2.6 | 3.1 | 6.7 | 7.1 | 7.5 | 7.9 | 8.4 |
| Accounts Payable, % | 11.92 | 2.17 | 9.83 | 2.34 | 2.89 | 5.83 | 5.83 | 5.83 | 5.83 | 5.83 |
| Capital Expenditure | -1.2 | -2.1 | -2.1 | -2.3 | -.6 | -1.9 | -2.0 | -2.1 | -2.2 | -2.4 |
| Capital Expenditure, % | -1.35 | -2.16 | -2.06 | -2.06 | -0.55735 | -1.64 | -1.64 | -1.64 | -1.64 | -1.64 |
| Tax Rate, % | -0.37727 | -0.37727 | -0.37727 | -0.37727 | -0.37727 | -0.37727 | -0.37727 | -0.37727 | -0.37727 | -0.37727 |
| EBITAT | -.5 | -2.8 | -3.2 | -59.5 | -1.5 | -11.9 | -12.5 | -13.3 | -14.1 | -14.9 |
| Depreciation | ||||||||||
| Changes in Account Receivables | ||||||||||
| Changes in Inventories | ||||||||||
| Changes in Accounts Payable | ||||||||||
| Capital Expenditure | ||||||||||
| UFCF | -47.5 | -5.4 | 2.1 | -49.3 | -8.8 | -21.7 | -16.1 | -17.1 | -18.1 | -19.1 |
| WACC, % | 13.92 | 14.62 | 14.55 | 14.78 | 14.8 | 14.53 | 14.53 | 14.53 | 14.53 | 14.53 |
| PV UFCF | ||||||||||
| SUM PV UFCF | -62.8 | |||||||||
| Long Term Growth Rate, % | 2.00 | |||||||||
| Free cash flow (T + 1) | -20 | |||||||||
| Terminal Value | -156 | |||||||||
| Present Terminal Value | -79 | |||||||||
| Enterprise Value | -142 | |||||||||
| Net Debt | 13 | |||||||||
| Equity Value | -155 | |||||||||
| Diluted Shares Outstanding, MM | 34 | |||||||||
| Equity Value Per Share | -4.51 |
What You Will Get
- Pre-Filled Financial Model: ZK International Group Co., Ltd.'s (ZKIN) actual data enables accurate DCF valuation.
- Full Forecast Control: Modify revenue growth, profit margins, WACC, and other essential drivers.
- Instant Calculations: Automatic updates allow you to view results in real-time as you make adjustments.
- Investor-Ready Template: A polished Excel file crafted for professional-level valuation.
- Customizable and Reusable: Designed for versatility, facilitating repeated use for in-depth forecasts.
Key Features
- Comprehensive ZKIN Data: Pre-filled with ZK International Group's historical performance and future projections.
- Fully Customizable Inputs: Modify revenue growth, profit margins, discount rates, tax implications, and capital investments.
- Dynamic Valuation Model: Automatic recalculations of Net Present Value (NPV) and intrinsic value based on user-defined inputs.
- Scenario Analysis: Develop various forecasting scenarios to evaluate different valuation results.
- User-Friendly Interface: Intuitive, organized, and suitable for both seasoned professionals and newcomers.
How It Works
- Download: Obtain the pre-prepared Excel file containing ZK International Group Co., Ltd.'s (ZKIN) financial data.
- Customize: Modify projections, including revenue growth, EBITDA %, and WACC to fit your analysis.
- Update Automatically: Watch as intrinsic value and NPV calculations refresh in real-time.
- Test Scenarios: Develop various forecasts and instantly compare the results.
- Make Decisions: Leverage the valuation outcomes to inform your investment strategy.
Why Choose ZK International Group Co., Ltd. (ZKIN) Calculator?
- Reliable Insights: Utilize authentic ZK International financial data for trustworthy valuation outcomes.
- Tailorable: Modify essential metrics such as growth projections, WACC, and tax rates to suit your forecasts.
- Efficiency Boost: Ready-made calculations save you from starting from the ground up.
- Expert-Level Tool: Crafted for investors, analysts, and consultants in the field.
- Easy to Use: User-friendly design and clear, step-by-step guidance ensure accessibility for everyone.
Who Should Use This Product?
- Investors: Evaluate ZK International Group Co., Ltd. (ZKIN) for informed investment decisions.
- CFOs and Financial Analysts: Optimize valuation methodologies and validate financial forecasts.
- Startup Founders: Discover valuation strategies employed by established companies like ZK International.
- Consultants: Provide comprehensive valuation analyses for clients in various sectors.
- Students and Educators: Utilize current data to enhance learning and understanding of valuation principles.
What the Template Contains
- Comprehensive DCF Model: Editable template featuring detailed valuation calculations tailored for ZK International Group Co., Ltd. (ZKIN).
- Real-World Data: ZK International's historical and projected financials preloaded for in-depth analysis.
- Customizable Parameters: Modify WACC, growth rates, and tax assumptions to explore various scenarios.
- Financial Statements: Complete annual and quarterly breakdowns for enhanced insights into ZKIN's performance.
- Key Ratios: Integrated analysis for profitability, efficiency, and leverage specific to ZK International Group Co., Ltd. (ZKIN).
- Dashboard with Visual Outputs: Charts and tables designed for clear, actionable results relevant to ZKIN.
Disclaimer
All information, articles, and product details provided on this website are for general informational and educational purposes only. We do not claim any ownership over, nor do we intend to infringe upon, any trademarks, copyrights, logos, brand names, or other intellectual property mentioned or depicted on this site. Such intellectual property remains the property of its respective owners, and any references here are made solely for identification or informational purposes, without implying any affiliation, endorsement, or partnership.
We make no representations or warranties, express or implied, regarding the accuracy, completeness, or suitability of any content or products presented. Nothing on this website should be construed as legal, tax, investment, financial, medical, or other professional advice. In addition, no part of this site—including articles or product references—constitutes a solicitation, recommendation, endorsement, advertisement, or offer to buy or sell any securities, franchises, or other financial instruments, particularly in jurisdictions where such activity would be unlawful.
All content is of a general nature and may not address the specific circumstances of any individual or entity. It is not a substitute for professional advice or services. Any actions you take based on the information provided here are strictly at your own risk. You accept full responsibility for any decisions or outcomes arising from your use of this website and agree to release us from any liability in connection with your use of, or reliance upon, the content or products found herein.