
|
Konka Group Co., Ltd. (000016.SZ) DCF Valuation |
Fully Editable: Tailor To Your Needs In Excel Or Sheets
Professional Design: Trusted, Industry-Standard Templates
Investor-Approved Valuation Models
MAC/PC Compatible, Fully Unlocked
No Expertise Is Needed; Easy To Follow
Konka Group Co., Ltd. (000016.SZ) Bundle
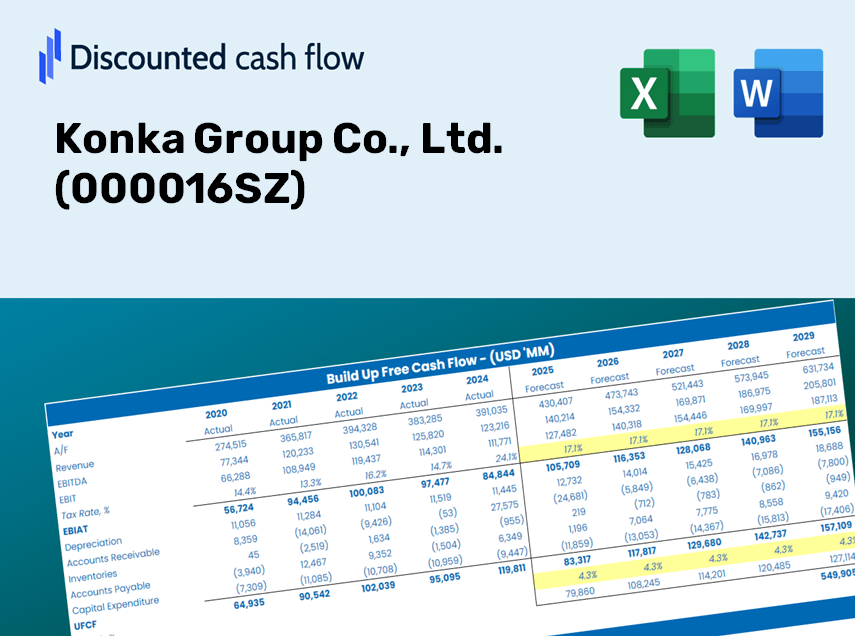
Gain insight into your Konka Group Co., Ltd. (000016SZ) valuation analysis with our sophisticated DCF Calculator! Preloaded with real (000016SZ) data, this Excel template enables you to adjust forecasts and assumptions for an accurate calculation of Konka Group Co., Ltd. intrinsic value.
Discounted Cash Flow (DCF) - (USD MM)
| Year | AY1 2020 |
AY2 2021 |
AY3 2022 |
AY4 2023 |
AY5 2024 |
FY1 2025 |
FY2 2026 |
FY3 2027 |
FY4 2028 |
FY5 2029 |
|---|---|---|---|---|---|---|---|---|---|---|
| Revenue | 50,351.8 | 49,106.5 | 29,607.9 | 17,849.3 | 11,114.8 | 7,790.8 | 5,460.9 | 3,827.7 | 2,683.0 | 1,880.6 |
| Revenue Growth, % | 0 | -2.47 | -39.71 | -39.71 | -37.73 | -29.91 | -29.91 | -29.91 | -29.91 | -29.91 |
| EBITDA | -1,211.8 | -1,502.0 | -2,169.3 | -1,932.5 | -1,564.8 | -587.4 | -411.7 | -288.6 | -202.3 | -141.8 |
| EBITDA, % | -2.41 | -3.06 | -7.33 | -10.83 | -14.08 | -7.54 | -7.54 | -7.54 | -7.54 | -7.54 |
| Depreciation | 397.6 | 469.9 | 445.8 | 498.5 | 494.3 | 163.5 | 114.6 | 80.3 | 56.3 | 39.5 |
| Depreciation, % | 0.7896 | 0.95699 | 1.51 | 2.79 | 4.45 | 2.1 | 2.1 | 2.1 | 2.1 | 2.1 |
| EBIT | -1,609.4 | -1,971.9 | -2,615.1 | -2,431.0 | -2,059.2 | -750.9 | -526.3 | -368.9 | -258.6 | -181.3 |
| EBIT, % | -3.2 | -4.02 | -8.83 | -13.62 | -18.53 | -9.64 | -9.64 | -9.64 | -9.64 | -9.64 |
| Total Cash | 6,049.8 | 6,489.6 | 5,988.1 | 6,976.0 | 4,402.4 | 1,934.4 | 1,355.9 | 950.4 | 666.2 | 466.9 |
| Total Cash, percent | .0 | .0 | .0 | .0 | .0 | .0 | .0 | .0 | .0 | .0 |
| Account Receivables | 9,250.5 | 8,758.0 | 3,348.3 | 2,435.3 | 2,684.4 | 1,329.3 | 931.7 | 653.1 | 457.8 | 320.9 |
| Account Receivables, % | 18.37 | 17.83 | 11.31 | 13.64 | 24.15 | 17.06 | 17.06 | 17.06 | 17.06 | 17.06 |
| Inventories | 4,521.3 | 4,068.5 | 4,409.8 | 3,249.9 | 2,694.6 | 1,162.5 | 814.9 | 571.2 | 400.4 | 280.6 |
| Inventories, % | 8.98 | 8.29 | 14.89 | 18.21 | 24.24 | 14.92 | 14.92 | 14.92 | 14.92 | 14.92 |
| Accounts Payable | 9,632.4 | 4,900.7 | 2,659.9 | 3,717.3 | 3,924.9 | 1,468.3 | 1,029.2 | 721.4 | 505.7 | 354.4 |
| Accounts Payable, % | 19.13 | 9.98 | 8.98 | 20.83 | 35.31 | 18.85 | 18.85 | 18.85 | 18.85 | 18.85 |
| Capital Expenditure | -5,639.7 | -6,639.9 | -3,613.1 | -1,476.6 | -620.5 | -791.2 | -554.6 | -388.7 | -272.5 | -191.0 |
| Capital Expenditure, % | -11.2 | -13.52 | -12.2 | -8.27 | -5.58 | -10.16 | -10.16 | -10.16 | -10.16 | -10.16 |
| Tax Rate, % | 13.61 | 13.61 | 13.61 | 13.61 | 13.61 | 13.61 | 13.61 | 13.61 | 13.61 | 13.61 |
| EBITAT | -1,531.7 | -1,136.2 | -1,859.9 | -1,935.8 | -1,779.0 | -585.6 | -410.5 | -287.7 | -201.7 | -141.4 |
| Depreciation | ||||||||||
| Changes in Account Receivables | ||||||||||
| Changes in Inventories | ||||||||||
| Changes in Accounts Payable | ||||||||||
| Capital Expenditure | ||||||||||
| UFCF | -10,913.2 | -11,092.7 | -2,199.5 | 216.4 | -1,391.4 | -782.7 | -544.4 | -381.6 | -267.5 | -187.5 |
| WACC, % | 5.43 | 4.19 | 4.64 | 4.92 | 5.14 | 4.87 | 4.87 | 4.87 | 4.87 | 4.87 |
| PV UFCF | ||||||||||
| SUM PV UFCF | -1,941.3 | |||||||||
| Long Term Growth Rate, % | 3.00 | |||||||||
| Free cash flow (T + 1) | -193 | |||||||||
| Terminal Value | -10,348 | |||||||||
| Present Terminal Value | -8,160 | |||||||||
| Enterprise Value | -10,101 | |||||||||
| Net Debt | 9,598 | |||||||||
| Equity Value | -19,699 | |||||||||
| Diluted Shares Outstanding, MM | 2,408 | |||||||||
| Equity Value Per Share | -8.18 |
What You Will Receive
- Genuine Konka Financials: Access historical and projected data for precise valuation.
- Customizable Inputs: Adjust parameters such as WACC, tax rates, revenue growth, and capital investments.
- Dynamic Calculations: Intrinsic value and NPV are computed automatically.
- Scenario Testing: Explore various scenarios to assess Konka’s potential future performance.
- User-Friendly Design: Crafted for industry experts while remaining easy to use for newcomers.
Key Features
- Genuine Konka Data: Pre-loaded with Konka Group's historical financial performance and forward-looking forecasts.
- Completely Adjustable Inputs: Tailor revenue growth, profit margins, WACC, tax rates, and capital expenditure settings.
- Interactive Valuation Model: Automatically recalculates Net Present Value (NPV) and intrinsic value based on your adjustments.
- Scenario Analysis: Develop multiple forecasting scenarios to evaluate varying valuation results.
- Intuitive User Interface: Designed for ease of use, catering to both industry professionals and beginners.
How It Works
- Step 1: Download the Excel file.
- Step 2: Review pre-entered Konka Group Co., Ltd. (000016SZ) data (historical and projected).
- Step 3: Modify key assumptions (yellow cells) according to your analysis.
- Step 4: Observe automatic recalculations for Konka Group Co., Ltd. (000016SZ)'s intrinsic value.
- Step 5: Utilize the outputs for investment decisions or reporting purposes.
Why Opt for This Calculator?
- User-Friendly: Crafted for both novices and seasoned users.
- Customizable Inputs: Easily adjust parameters to suit your analysis needs.
- Real-Time Adjustments: Observe immediate changes in Konka Group’s valuation as you modify inputs.
- Pre-Configured: Comes with Konka Group’s actual financial data for swift evaluations.
- Relied Upon by Experts: Utilized by investors and analysts for making educated decisions.
Who Can Benefit from This Product?
- Finance Students: Explore valuation techniques and put them into practice using real data.
- Researchers: Utilize professional models for your academic projects or studies.
- Investors: Validate your assumptions and assess valuation results for Konka Group Co., Ltd. (000016SZ).
- Analysts: Enhance your efficiency with a customizable DCF model designed for quick use.
- Entrepreneurs: Discover how major public firms like Konka Group Co., Ltd. (000016SZ) are evaluated in the market.
Contents of the Template
- Preloaded KONKA Data: Historical and forecasted financial information, including revenue, EBIT, and capital expenditures.
- DCF and WACC Models: Advanced sheets designed for calculating intrinsic value and Weighted Average Cost of Capital.
- Editable Inputs: Yellow-highlighted cells for modifying revenue growth, tax rates, and discount rates.
- Financial Statements: Detailed annual and quarterly financials for in-depth analysis.
- Key Ratios: Metrics for profitability, leverage, and efficiency to assess performance.
- Dashboard and Charts: Visual representations of valuation results and underlying assumptions.
Disclaimer
All information, articles, and product details provided on this website are for general informational and educational purposes only. We do not claim any ownership over, nor do we intend to infringe upon, any trademarks, copyrights, logos, brand names, or other intellectual property mentioned or depicted on this site. Such intellectual property remains the property of its respective owners, and any references here are made solely for identification or informational purposes, without implying any affiliation, endorsement, or partnership.
We make no representations or warranties, express or implied, regarding the accuracy, completeness, or suitability of any content or products presented. Nothing on this website should be construed as legal, tax, investment, financial, medical, or other professional advice. In addition, no part of this site—including articles or product references—constitutes a solicitation, recommendation, endorsement, advertisement, or offer to buy or sell any securities, franchises, or other financial instruments, particularly in jurisdictions where such activity would be unlawful.
All content is of a general nature and may not address the specific circumstances of any individual or entity. It is not a substitute for professional advice or services. Any actions you take based on the information provided here are strictly at your own risk. You accept full responsibility for any decisions or outcomes arising from your use of this website and agree to release us from any liability in connection with your use of, or reliance upon, the content or products found herein.